Fire Mapping & Flame Detection
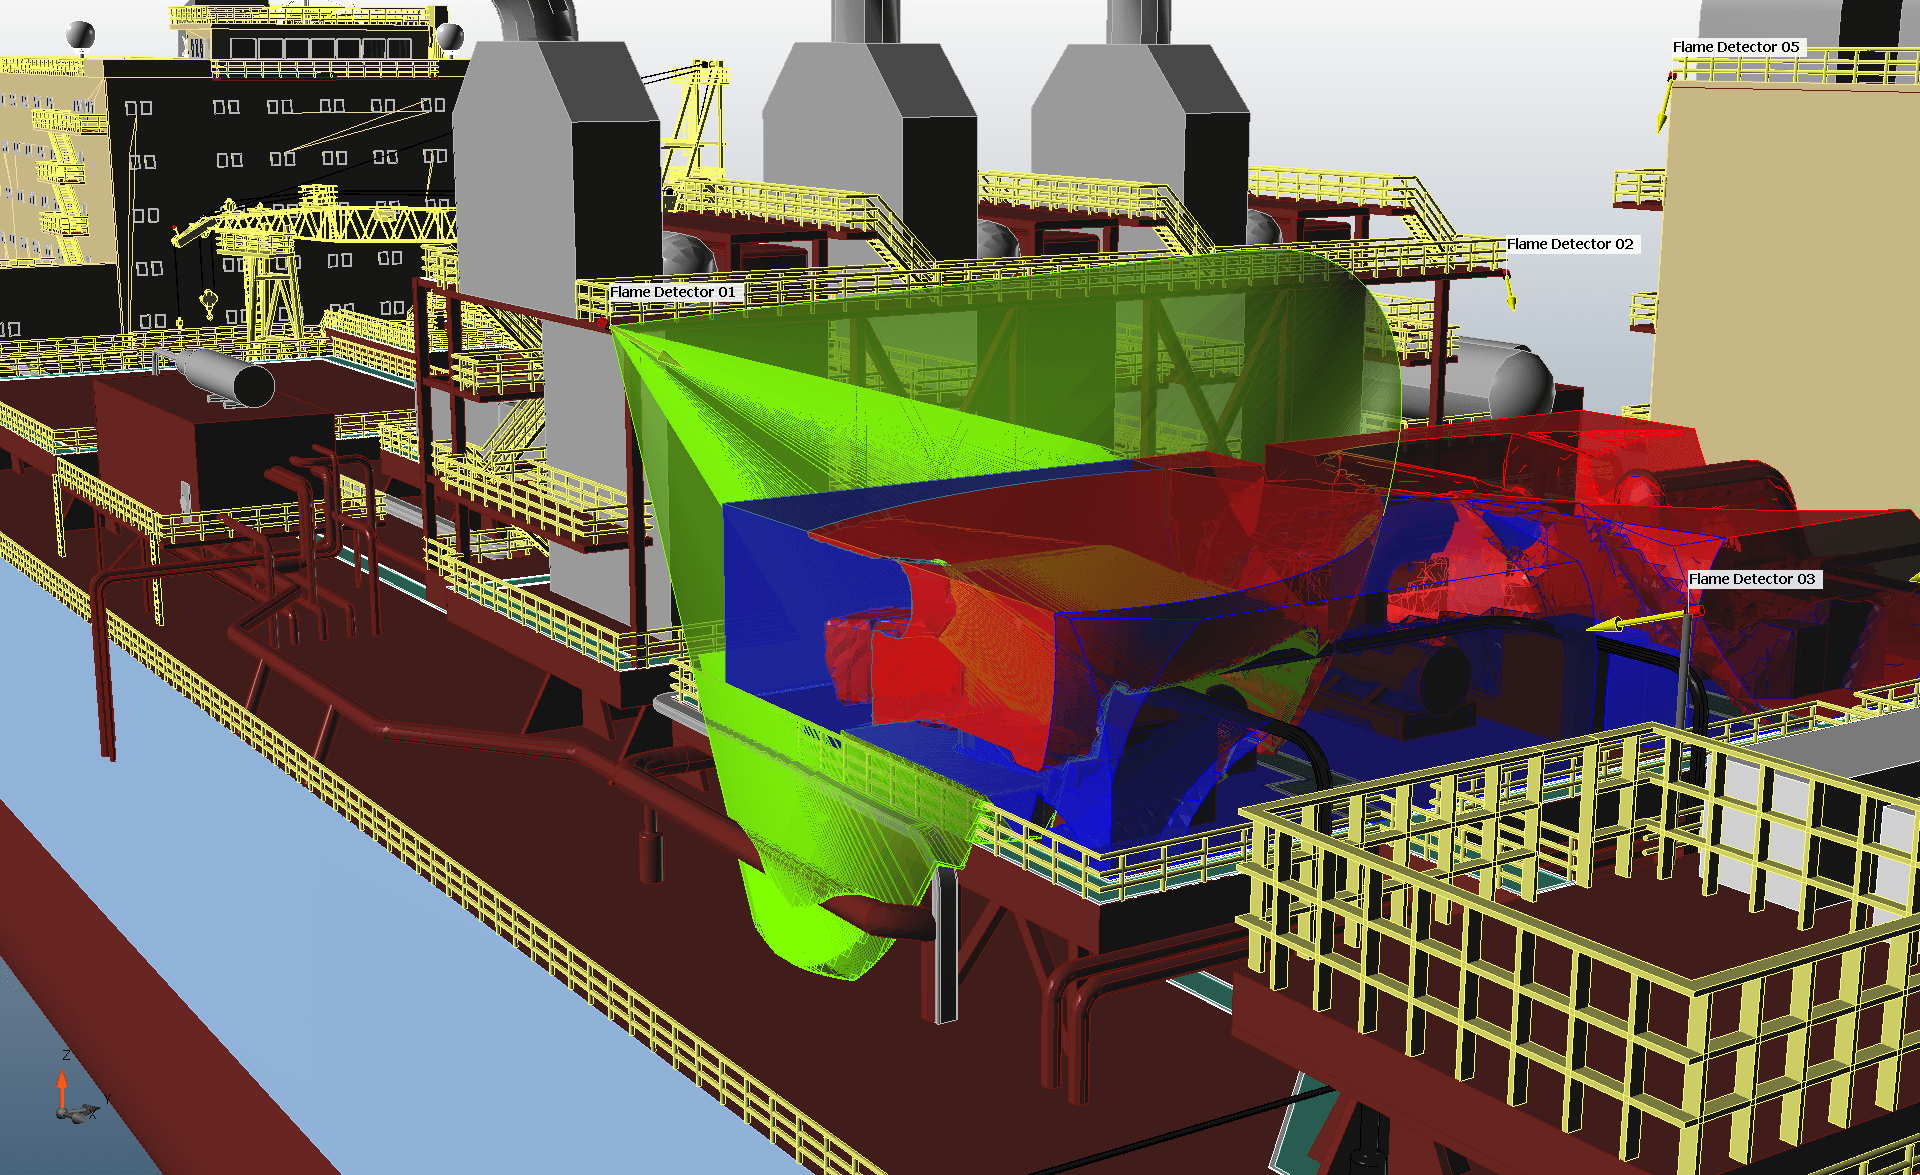
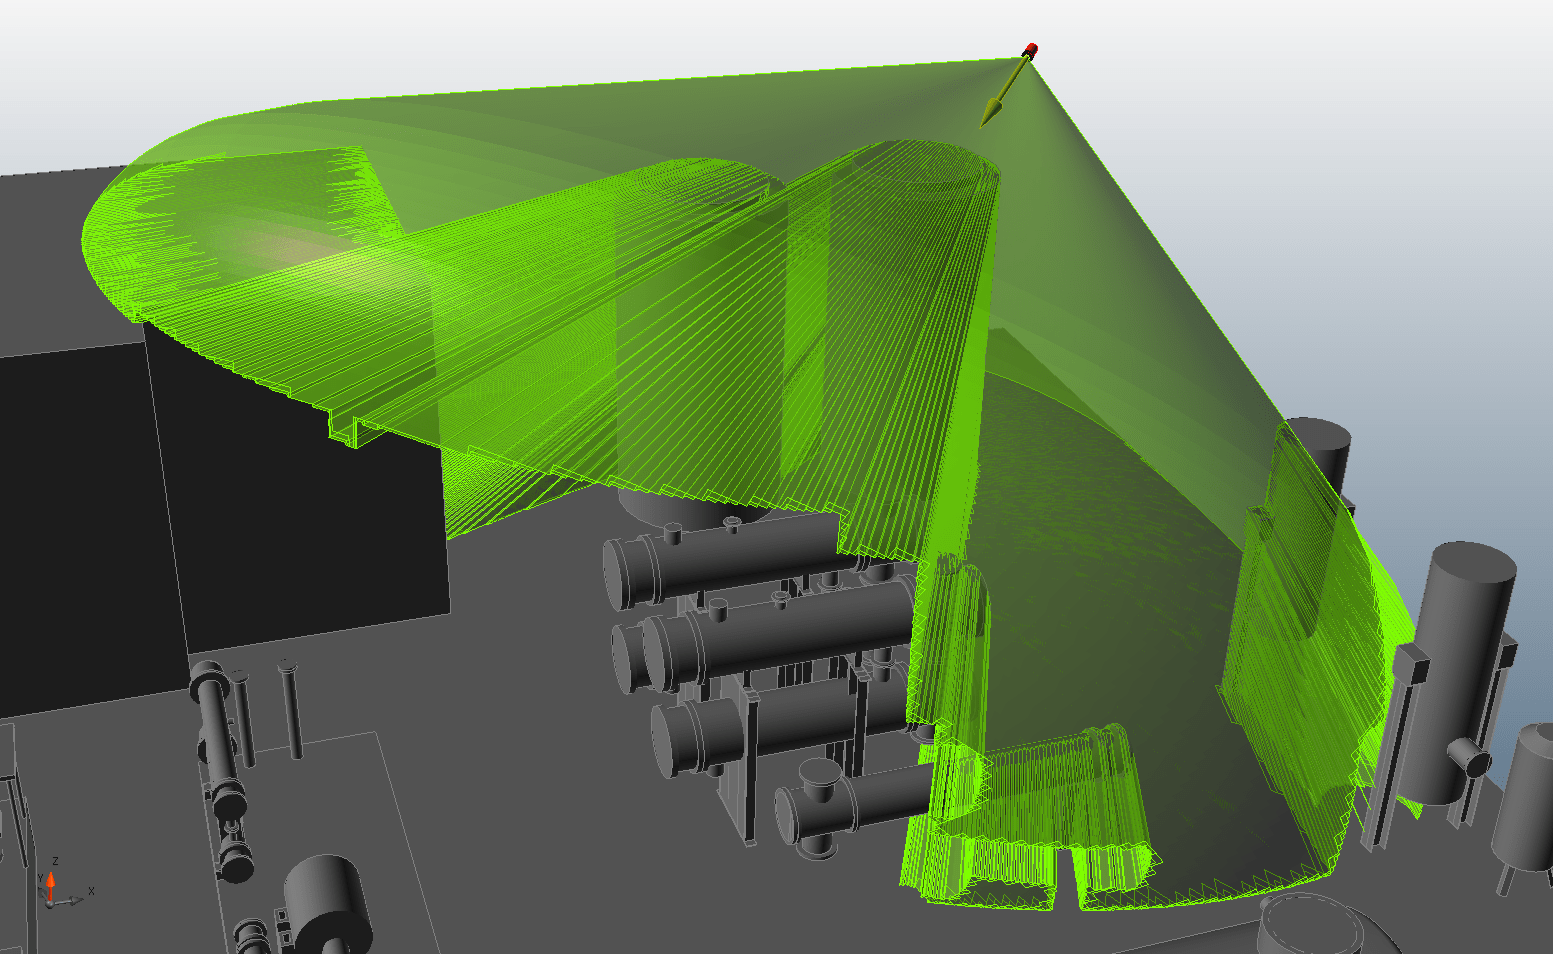 Detect3D uses powerful ray-casting algorithms to accurately determine the obstructed field of view of flame detectors. Using the data from thousands of rays cast from each detector, a full 3D representation of coverage areas is built, which can be visualized using contours or isovolumes. The true power of Detect3D is exemplified when working with the most complex of CAD files, where the ray casting analysis takes seconds, not hours. The speed, accuracy, and quick availability of results provides engineers with unique insight into flame detector layouts.
Any manufacturer and model of flame detector can be used with Detect3D. Insight Numerics has partnered with several manufacturers to provide a live database of Field-Of-View (FOV) information (maximum range, cone of vision etc.) that can be used directly in projects. In addition to the manufacturer data, custom FOVs can be created by the users, and saved to the user’s own database. Different manufacturers and models can be used in the same project, and changing the manufacturer or model mid-project is achieved in a couple of mouse clicks.
The coverage for multiple fire sizes can be calculated by applying FOV multipliers to risk grades. There’s no need for separate projects for different fire sizes – it can all be managed in the same simulation.
Once you have completed the fire mapping project, the detector locations and orientations can be exported to Excel. For even greater CAD integration, the detectors can also be exported to CAD files (DGN and DWG), ready to be imported into your own CAD software.
Gas Mapping & Gas Detection
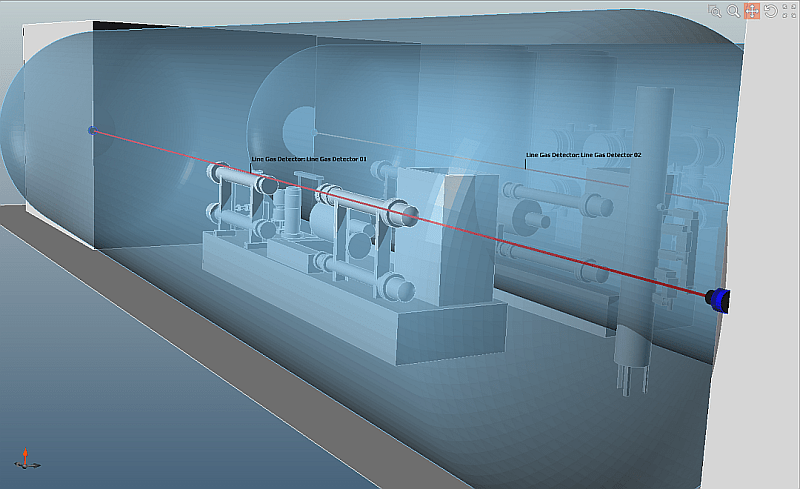 Point and open-path gas detectors can be added in Detect3D for the assessment of gas detector layouts. Adding gas detectors is simple – just click on the locations of the detectors, or enter the coordinates directly, and the detector is added. And just like the flame detectors, a powerful Excel import feature is available if the detector locations are already known.
The 3D coverage data for the gas detector layout can be viewed using contours and isovolumes. Once the gas mapping is complete, detector locations can be exported to Excel or CAD (DGN and DWG).
Fire and Gas Mapping Optimization
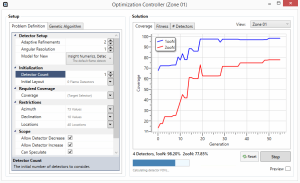 Detect3D is the only fire and gas mapping software available to offer automated positioning of detector layouts using Genetic Algorithms. While manual placement of detectors is the “standard” method of creating a detector layout, the power of the optimization capability is huge. The use of optimization to minimize detector counts in the project has significant potential cost savings. It also has less obvious benefits such as improved workflow, greater quality assurance, and batch processing.
There is no doubt that Detect3D’s optimization capability is game changing for fire and gas mapping. As the Genetic Algorithm itself has been written from scratch by Insight Numerics, it is finely tuned to provide optimized detector layouts. No special hardware is required, and in many cases, the layout is available in just a few minutes. For more complicated cases, overnight runs may be required.
CAD Integration
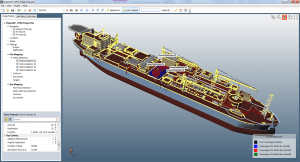
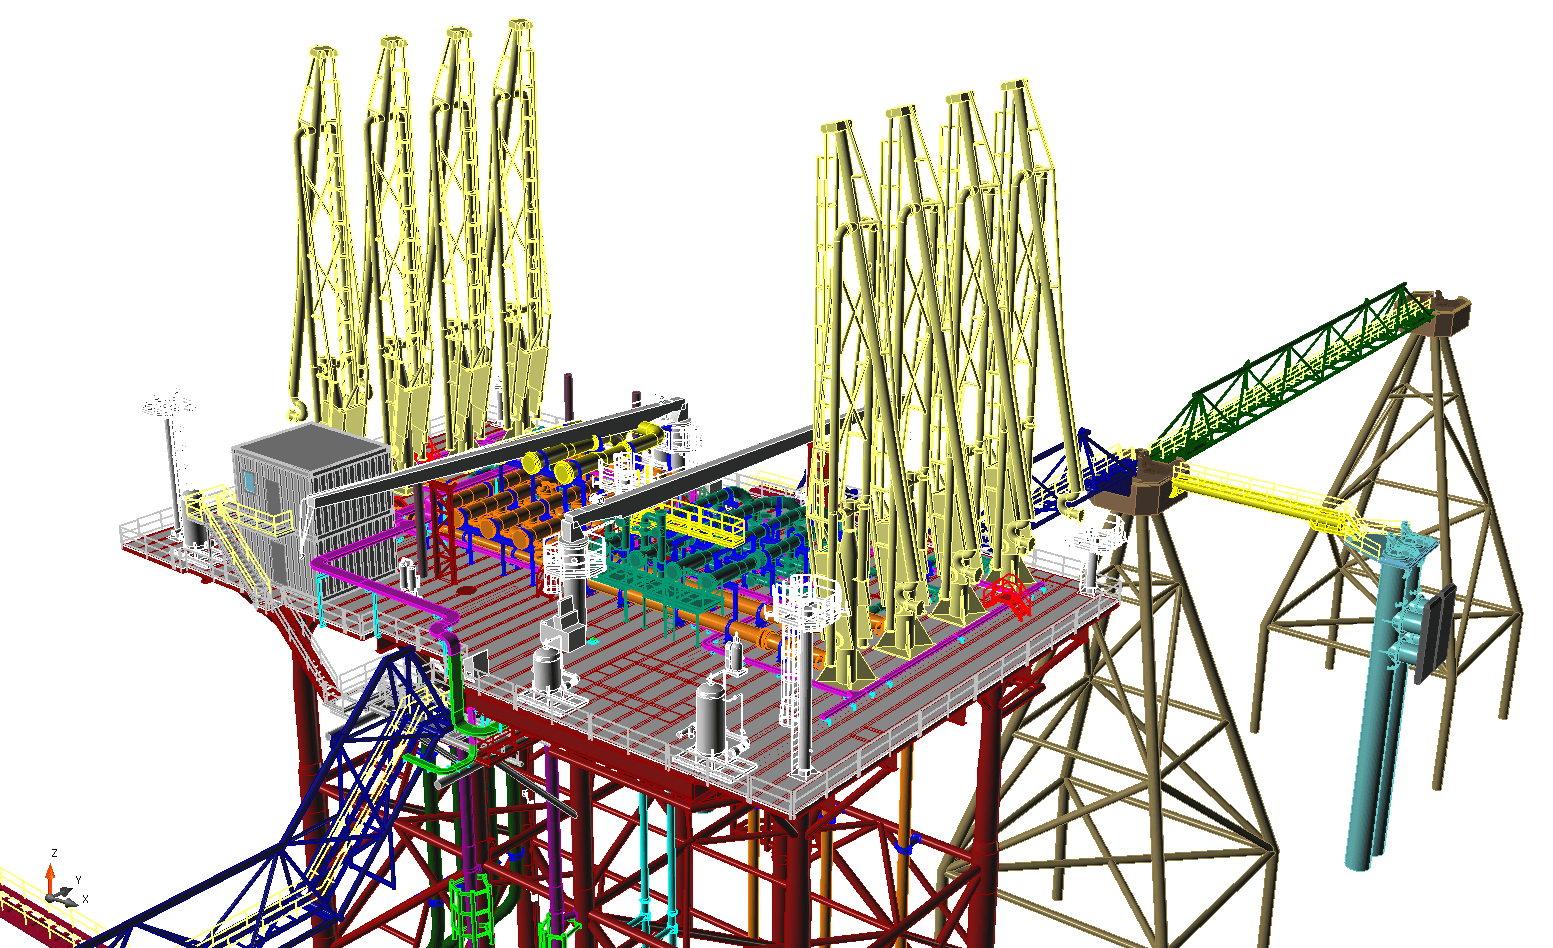 Importing CAD files into Detect3D is seamless. From basic process areas to full offshore platforms or onshore facilities, the import process is fast and designed specifically for fire and gas mapping projects. Multiple CAD files can be loaded into the same project, and even created in the software itself. The following CAD formats are supported: Microstation® (DGN), Navisworks files (via the DWF importer), Autodesk AutoCAD® (DWG, DXF), STEP, IGES, OBJ and STL.
The ease of the 3D CAD import capabilities make responding to design changes quick and easy. Outdated designs can be removed from the Detect3D project, and replaced by the new CAD files. All detectors, zones and other features in the project remain in-place. Detect3D automatically recalculates the coverage based on the new CAD file, and can highlight potential problems caused by the new design. This process no longer takes weeks – updated coverage is available within minutes.
CAD Creation Tool
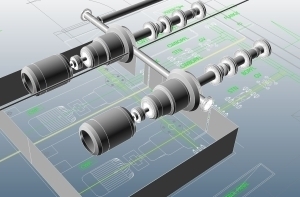 Detect3D works just as well with 2D CAD. AutoCAD DWG files can be imported using the 2D CAD import capabilities, and be used as a design basis for creating a 3D geometry with Detect3D’s in-built CAD Creation Tool. Extrusions, pipework and revolved surfaces can be created with ease, together with available 3D primitives such as cuboids and cylinders. These objects can be created independently of the 2D CAD, and can even be based on imported images. Whichever form the 2D data takes, a 3D geometry can be created for the fire and gas mapping project within minutes.
Detector Database
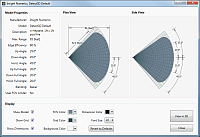 Insight Numerics partners with leading detector manufacturers to provide Detect3D users with the most accurate data for flame detector fields-of-view (FOVs). The “Manufacturers’ Database” is a live database populated with FOV characteristics as defined by the manufacturers themselves. Many FOVs are available for different models, fire sizes and types, and sensitivities. The database is effectively a “live link” between all Detect3D users and many of the world’s leading detector manufacturers.
Once defined, an FOV can be used in the Detect3D project, and exported for other Detect3D projects.
Coverage Visualization
 The main 3D window in Detect3D uses OpenGL for smooth graphical visualization of the project. Coverage is especially important for evaluating the effectiveness of detector layouts. In Detect3D, all coverage data is three dimensional, and can be visualized using contours on horizontal or vertical planes, or using isovolumes (simply “3D contours”). The mark of a true 3D fire and gas mapping software is the ability to display 3D isovolumes, as they are an indication of volumetric coverage calculation – accept no substitutes!
In complex projects, where the geometry may obstruct the clear view of the results, a “clip plane” is available. The clip plane removes geometry above or below it from view, allowing a clearer picture of the coverage that may otherwise be obscured to the user.
Equipment Coverage
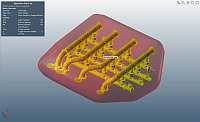 In many fire and gas mapping projects, the coverage is required at a certain distance from key equipment items. Often, this coverage is more important than the coverage in a larger zone, especially for onshore projects. The “Equipment Pick Tool” in Detect3D allows the user to select equipment defined in the CAD file, and build “Sub-Zones” around the equipment at a specified distance (for example, 2 meters). As separate coverage information is provided for Sub-Zones, the coverage around the equipment can also be reported.
For even quicker sub-zone definition, the expansion distance can be linked to the risk grade, and therefore the performance standard. For example, Risk Grade A could be 1 meter, Grade B, 2 meters, and Grade C, 3 meters. Whenever equipment is selected and the risk grade of the subzone is chosen, the expansion distance is automatically set. Combining this functionality with the FOV multiplier and gas cloud diameter specification for each subzone creates the ability to analyze different fire sizes at different distances from the equipment.
Automatic Report Generation
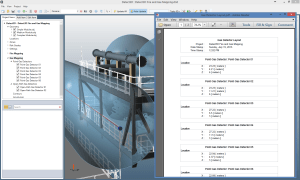 Detect3D eases the burden of reporting. Reports for detector layouts and zone coverage can be exported to Microsoft Excel and PDF files to incorporate into a final report. All views in the main 3D window can be exported to images files, or copied to the clipboard quickly with a Ctrl+C input which can be pasted into any software that accepts images, such as Microsoft Word. Detect3D has been designed from the start with the engineer in mind – it is no mistake that reporting is a pain-free task with Detect3D.
Viewing Mode
 Viewing mode is a free mode of operation of Detect3D, and allows project (.d3d) files to be loaded into the software for viewing. Anyone has the ability to download and install Detect3D and using Viewing Mode without purchasing a license. The accessibility of viewing mode is perfect for reviewing results during a project, for communicating results to end-users and clients, and for marketing Detect3D capabilities.