Online User Guide and Tutorials
Click on one of the tabs below to open a brief description of each tutorial. Included in the online guide are descriptions of capabilities, step-by-step tutorials, and CAD import/editing instructions.

 Getting Started
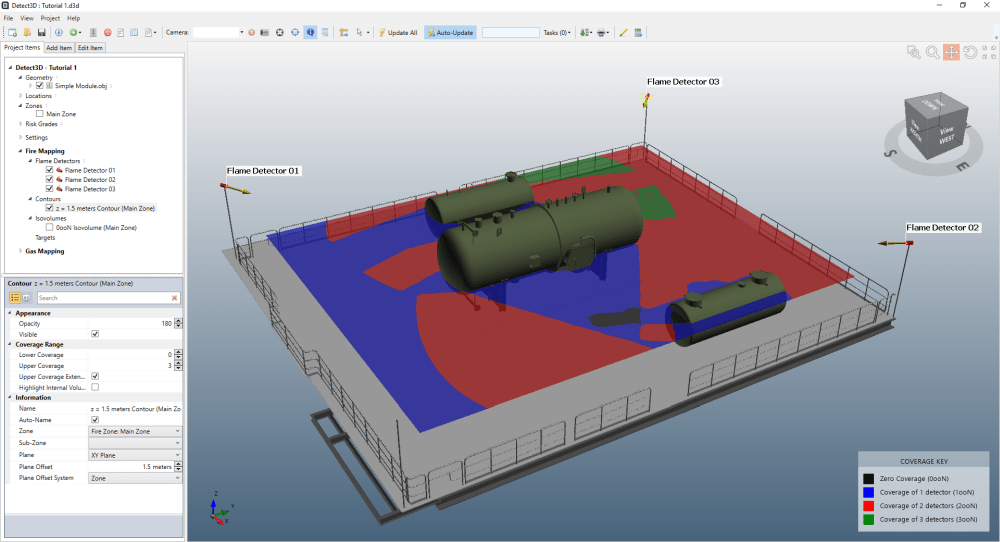
This tutorial will assist you in placing multiple flame detectors within the project and will then help you see the varying levels of coverage within a defined fire zone. You will add contours and isovolumes in order to visualize areas of the fire zone which are seen by 0, 1, 2, or 3+ flame detectors.
Detect3D generates a three-dimensional assessment of point and open-path gas detectors by considering a spherical gas cloud at 100% LEL concentration. Although gas clouds can exist in an infinite array of shapes and sizes, this “geographic method” is a commonly used approach. Gas detector layouts are then designed based on this idealized sphere of gas, placing devices to prevent this gas cloud from going undetected.
This tutorial will cover adding point and open-path gas detectors to a project. Three contours will be used to visualize coverage results within the defined zone.
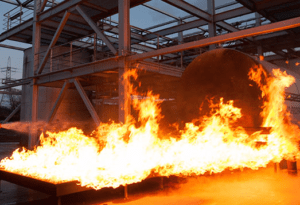
Mapping projects are commonly carried out by initially placing detectors and then assessing regions of visibility for those detectors that have be placed. This is done to identify where fires could potentially start and not be immediately detected. This post-processing mapping approach is not always necessary but can be useful depending on performance criteria.
Detect3D allows for users to place items called “targets” in which users can use as regions to protect or act as a fire of a particular wattage. This can be helpful in order to determine which detectors can or cannot see the hypothetical “target”. This method of analysis does not require the use of zones.
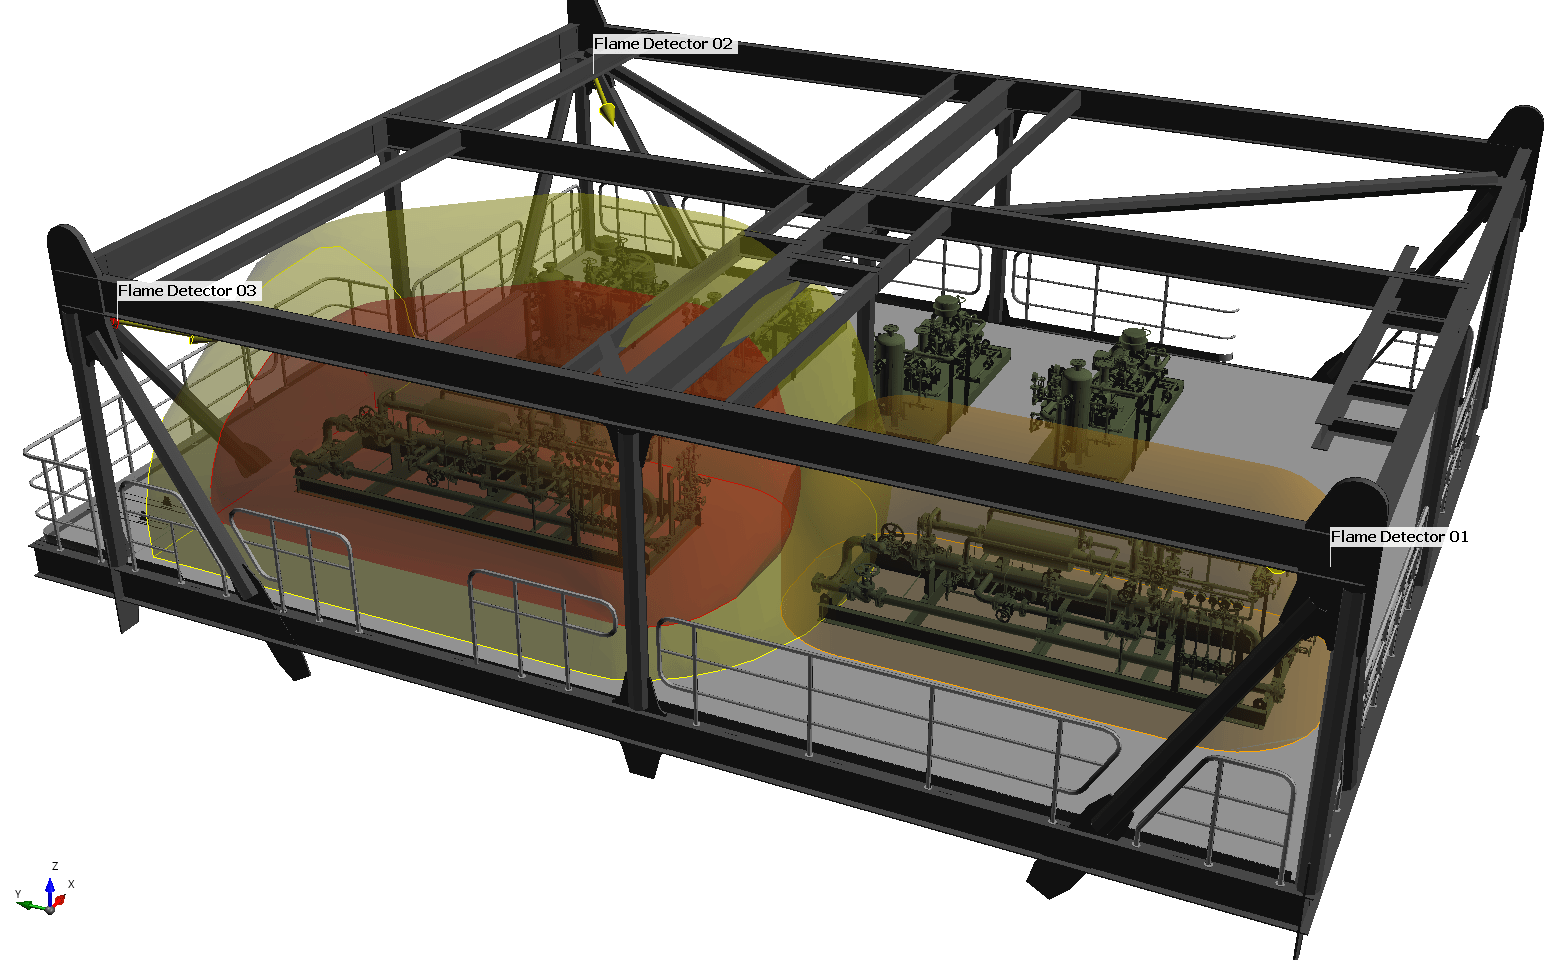
Detect3D allows users to add several zones in one project. Each zone can be further divided into multiple sub-zone regions. A sub-zone is a smaller zone region defined within a larger parent zone with its own risk grade and coverage statistics. In Detect3D coverage statistics are calculated for each zone type and risk grade. A special type of sub-zone called a Null Zone can also be defined to remove volumes deemed not needed in the coverage analysis.
 Learn More
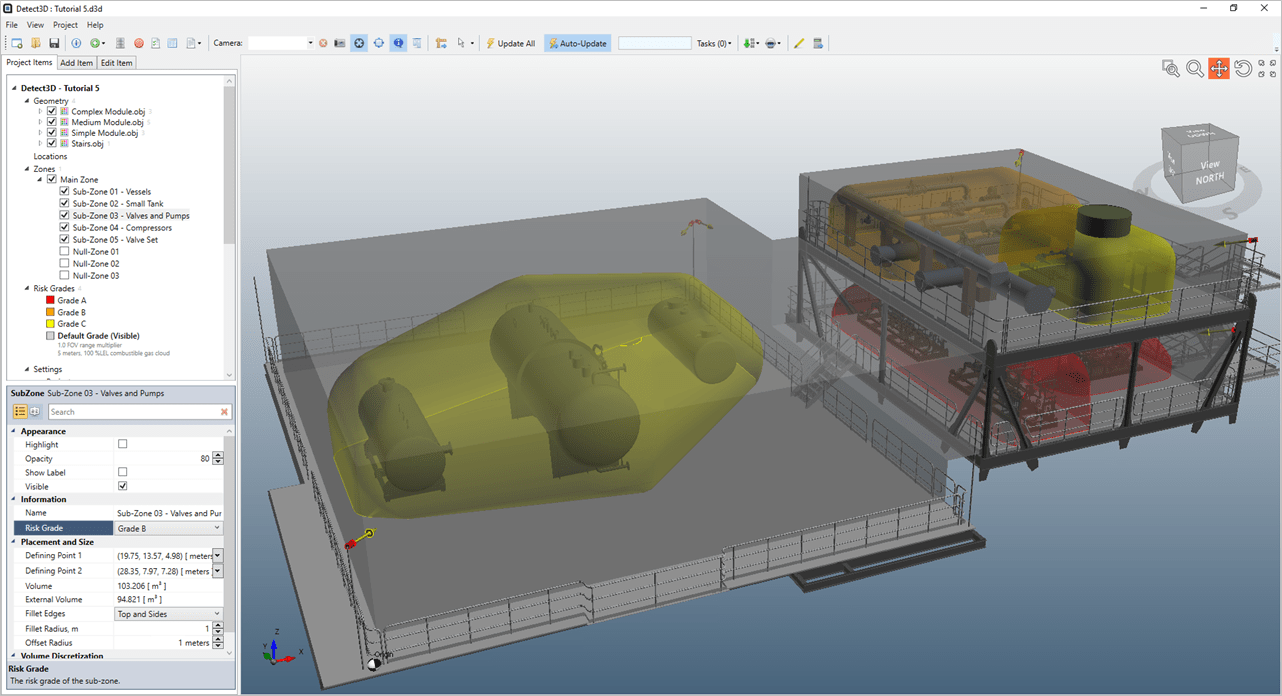
Detect3D’s risk grades allow user to change the analysis to better match various performance standards. Examples of what risk grades can be used for include: obtaining separate coverage statistics for a group of zones or sub-zones, changing the field-of-view multiplier of flame detectors to account for varying fire sizes, changing the size of the theoretical gas cloud for gas mapping, and more.
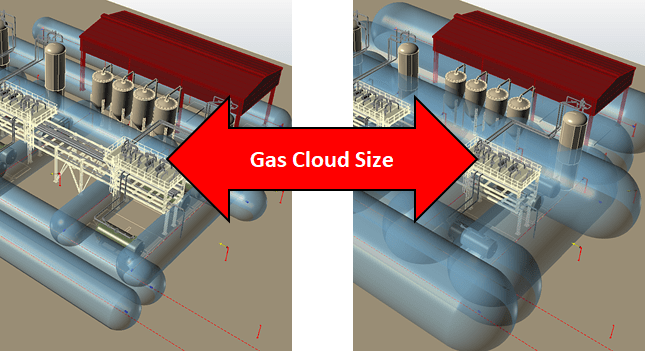
Performance standards often ask for varying gas cloud sizes for different types of risk areas in a facility. Detect3D makes use of the spherical gas cloud methodology created by the UK HSE for gas detector mapping. This tutorial will go over changing the size of the gas cloud in a Detect3D analysis after detectors have already been added to the project by creating and new risk grade and setting it as the “Visible Risk Grade.”
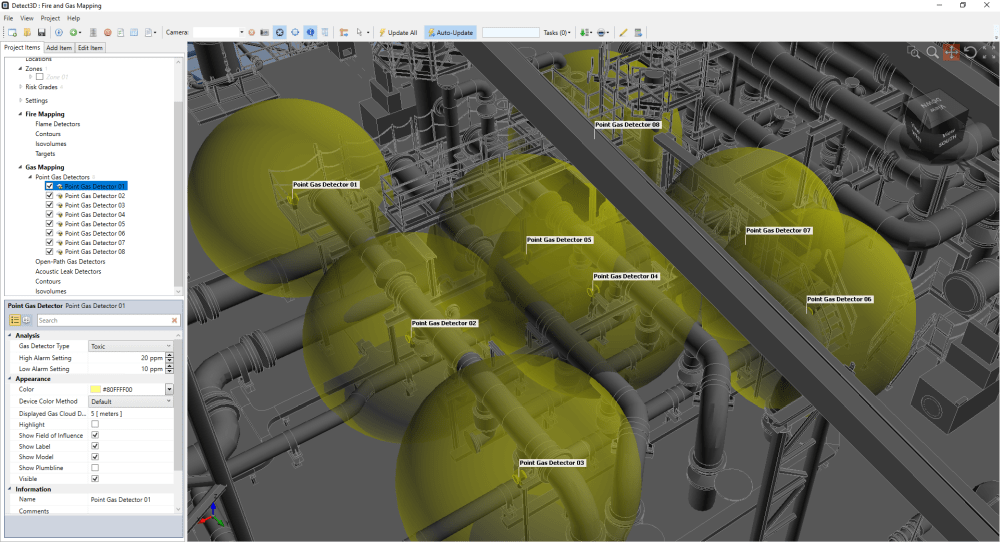
Toxic gas detectors are commonly placed near accommodation areas and region with high volumes of personnel and are used to detect varying toxic gases (e.g. H2S, CO, CO2, HF, etc).
In Detect3D, toxic gas detectors can be either of point type or open-path. Users may add a new gas detector with a toxic type or change an existing detector.
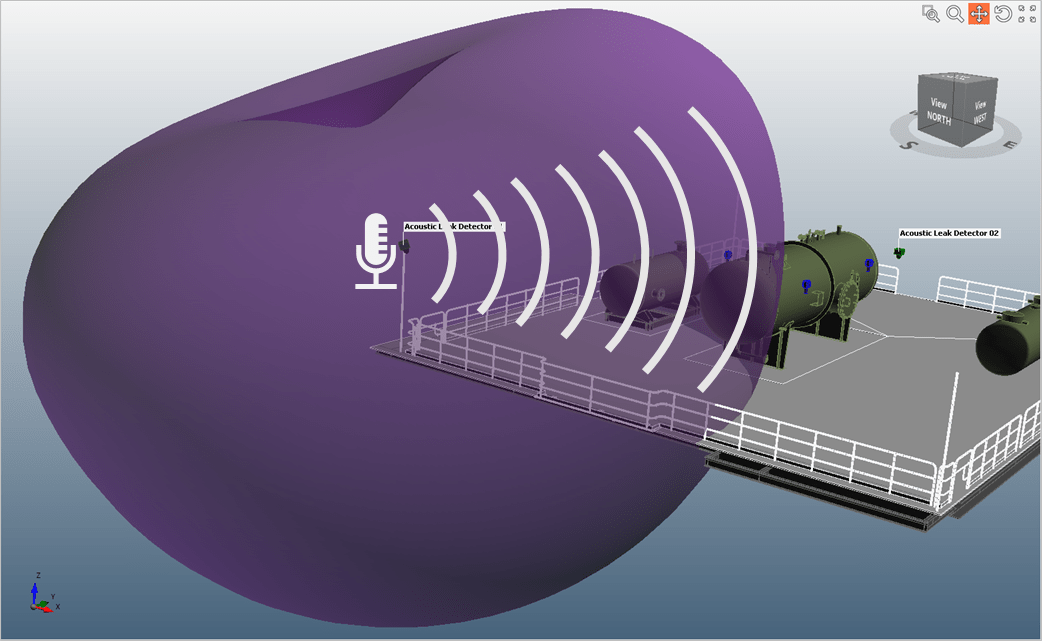
Acoustic leak detection has become more prominent in recent years. The devices “listen” for a gas leak which is outside the range of human hearing. When a gas leak occurs a pressure wave will propagate from the source throughout the facility, the acoustic detector will alarm if the pressure wave is above a specified threshold.
Most of the acoustic detectors make use of high end microphones to detect this pressure wave. Due to the nature of the microphones a polar plot is used to describe the range of hearing of the acoustic detectors.
 Advanced
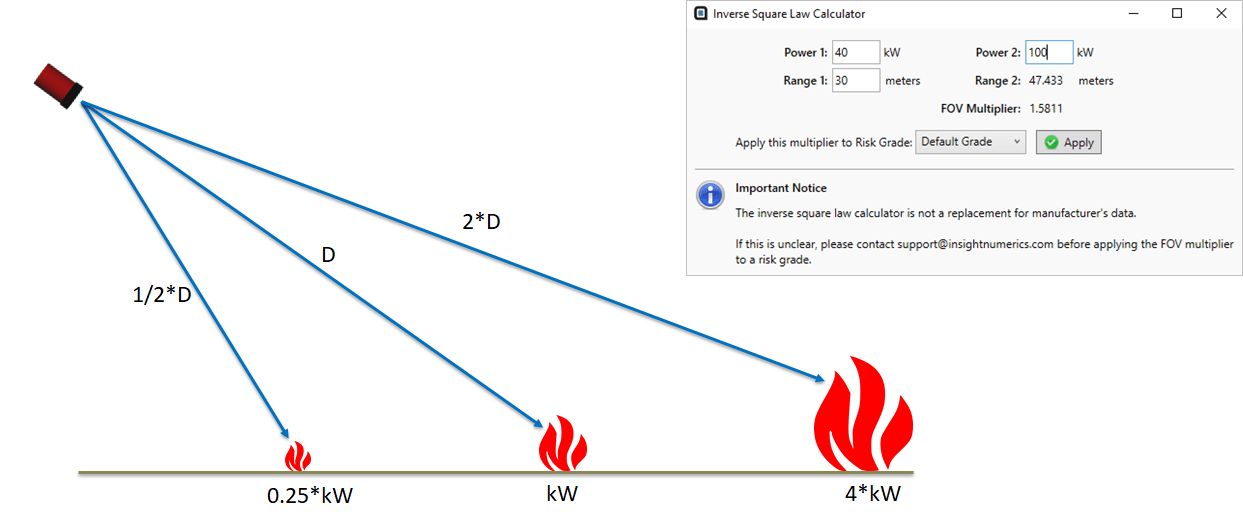
The Field-Of-View (FOV) Multiplier is a value which extends or degrades the maximum range for flame detectors in the project. A value of 1 indicates no change to the maximum range. This property is useful in conjunction with the inverse square law to perform analyses for varying fire sizes.The FOV Multiplier is a property of risk grades in Detect3D which can be made Visible to appear in the 3D window or can be assigned to zones or sub-zones in the project.
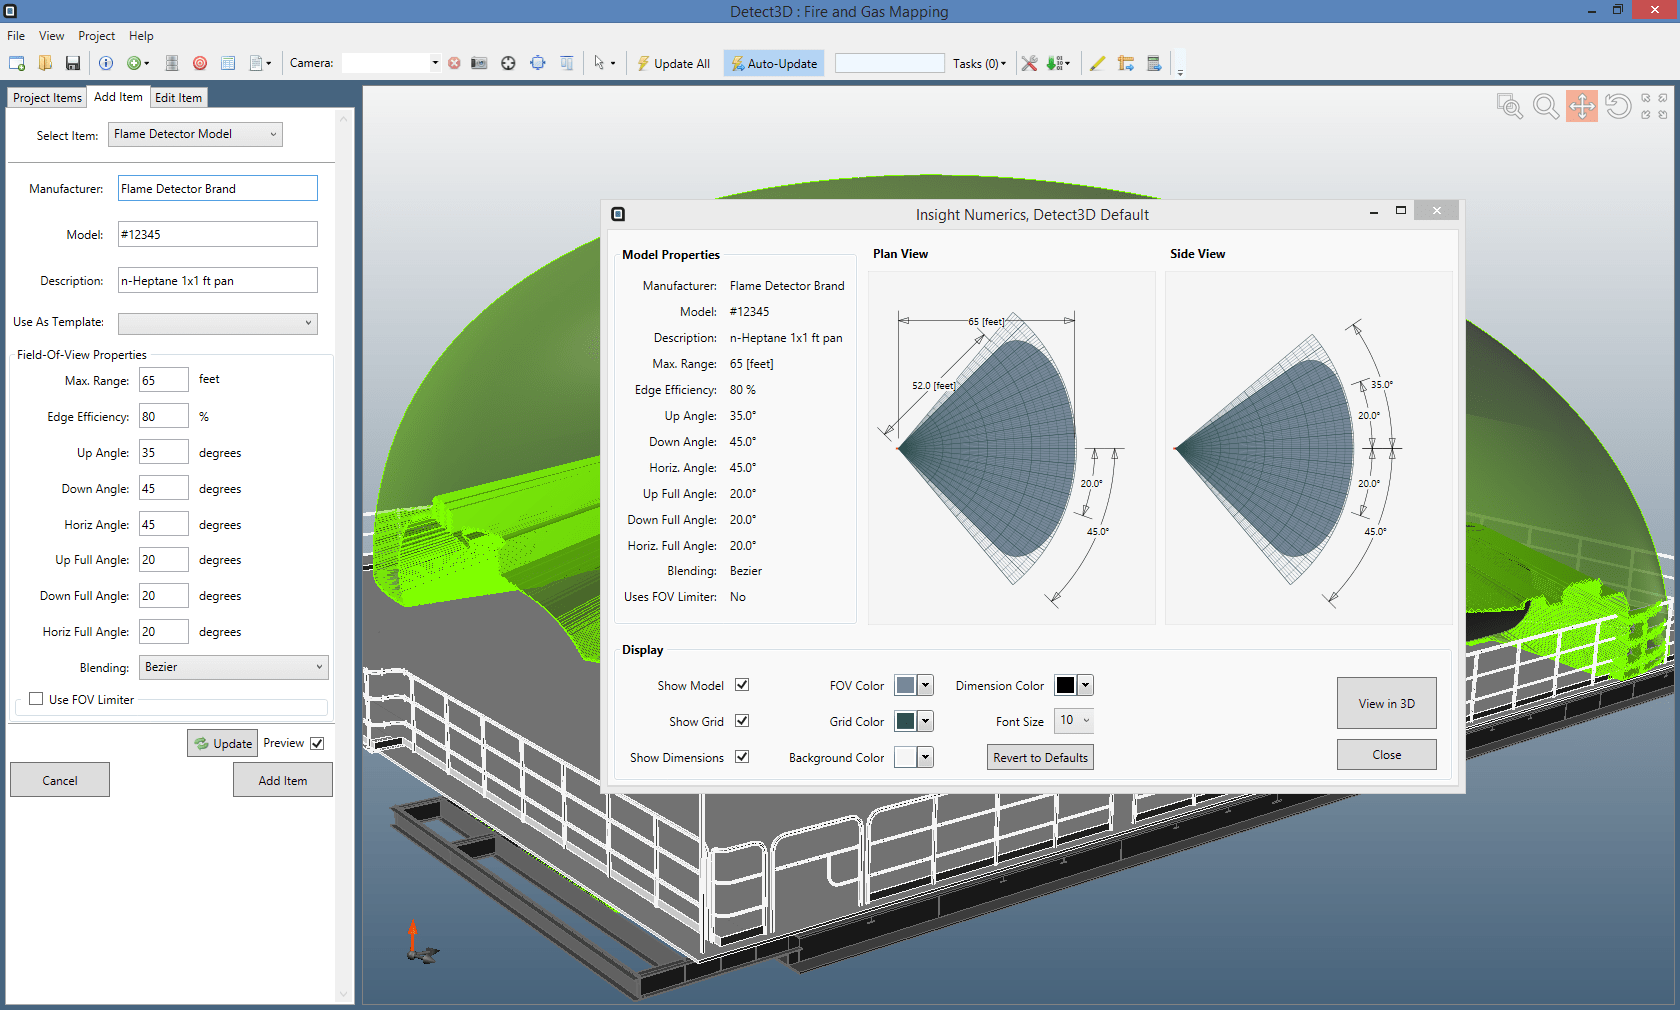
Using Detect3D’s flame detector model creator, users can add most manufacturer specified flame detector field-of-views (FOVs). This tutorial will go through how to use the criteria defined by Insight Numerics to create a flame detector model and save it to the detector database.
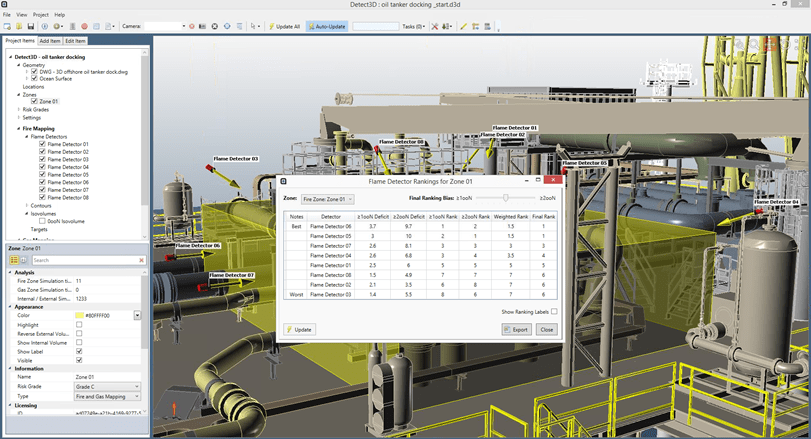
Each previous tutorial has gone over adding items or moving items once they are already in place. This tutorial will show how to disable detectors in order to assess reliability of the project in case a detector is removed for maintenance purposes or is not functioning. The tutorial will also go over how to reduce the number of detectors in the analysis while achieving a performance criteria of having less than 10% 0ooN coverage, over 90% 1ooN coverage, and over 70% 2ooN coverage.
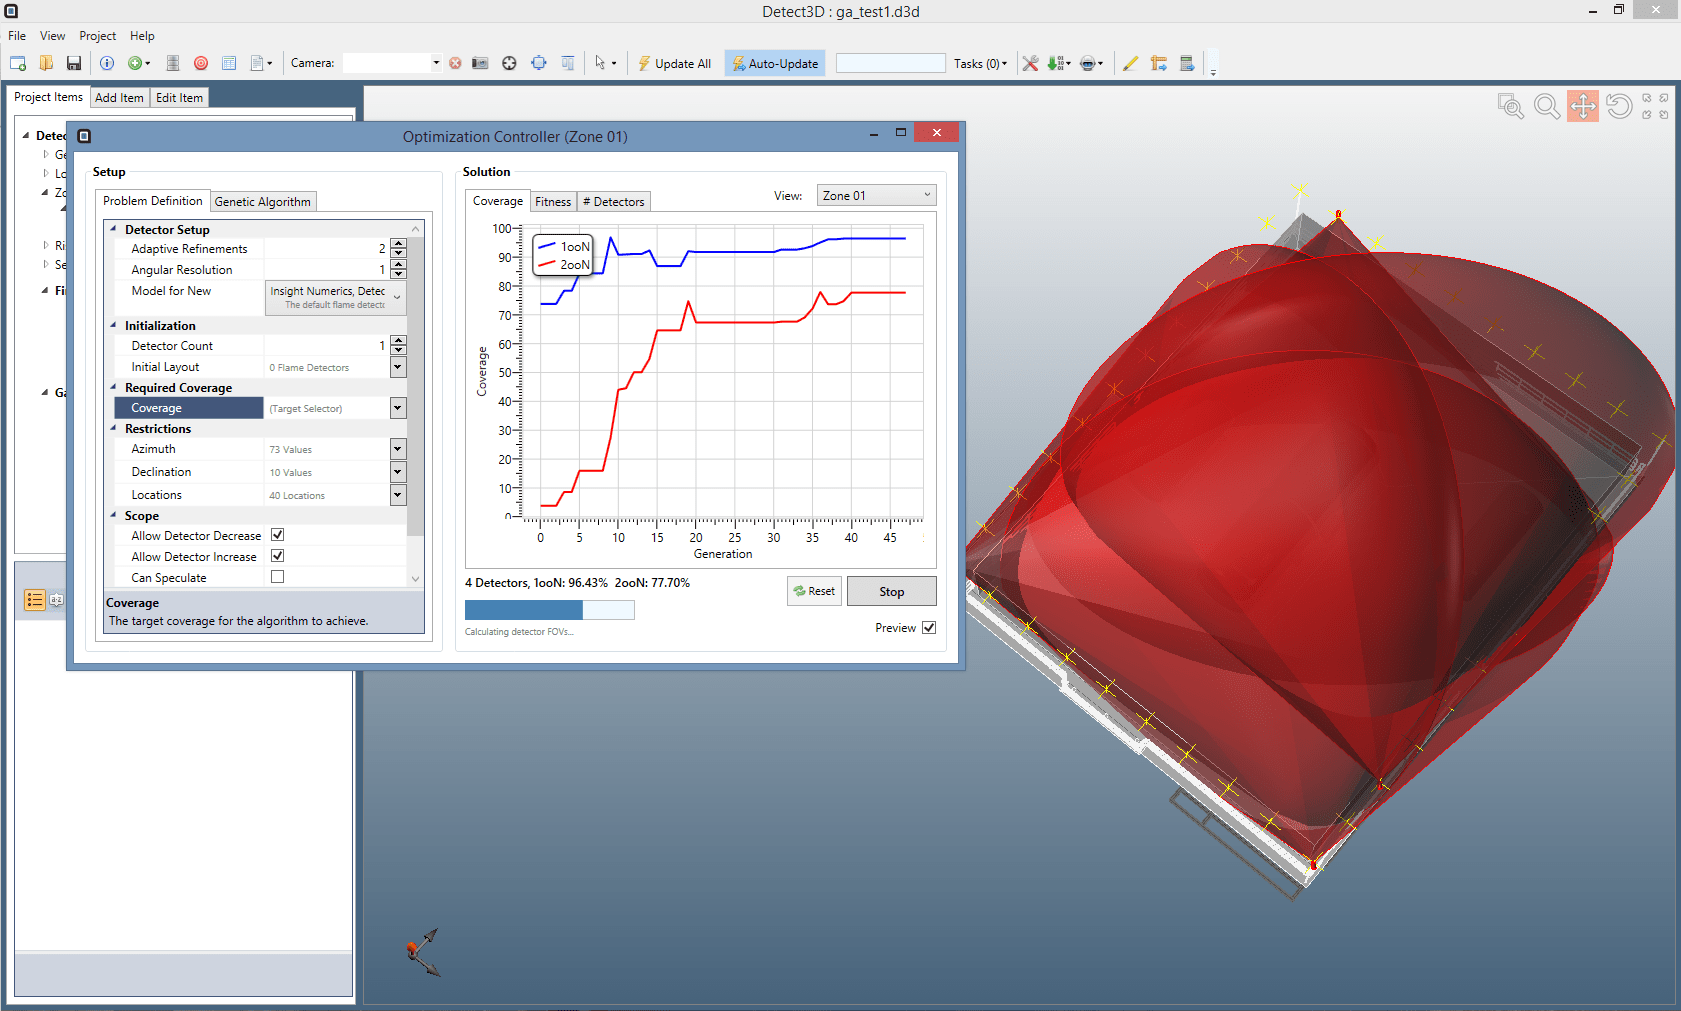
This tutorial will help you to get started with the optimization capabilities of Detect3D. You will set up an optimization simulation by importing a geometry, setting up a fire zone, then running the Genetic Algorithm.
Please read the Optimization section of the help file for information on terminology as well as how the genetic algorithm is applied to fire and gas mapping.

 Getting Started
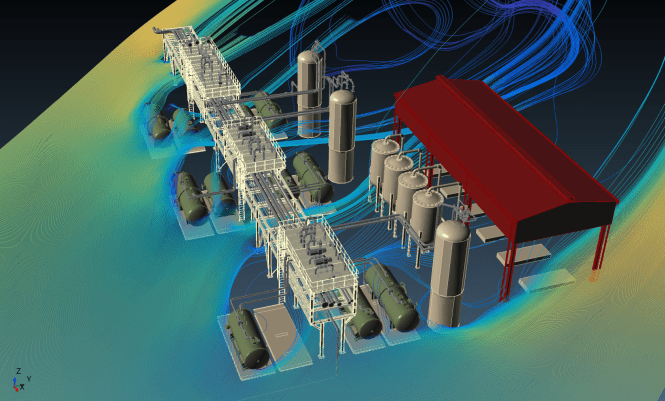
This tutorial will go over the initial setup of in:Flux. A 3D CAD file will first be imported and then a wind profile defined. in:Flux will automatically size the domain and generate the mesh needed for the CFD simulation. The simulation monitor will be examined for showing currently computed mesh and contours as well as indicating residual values of the CFD calculation.
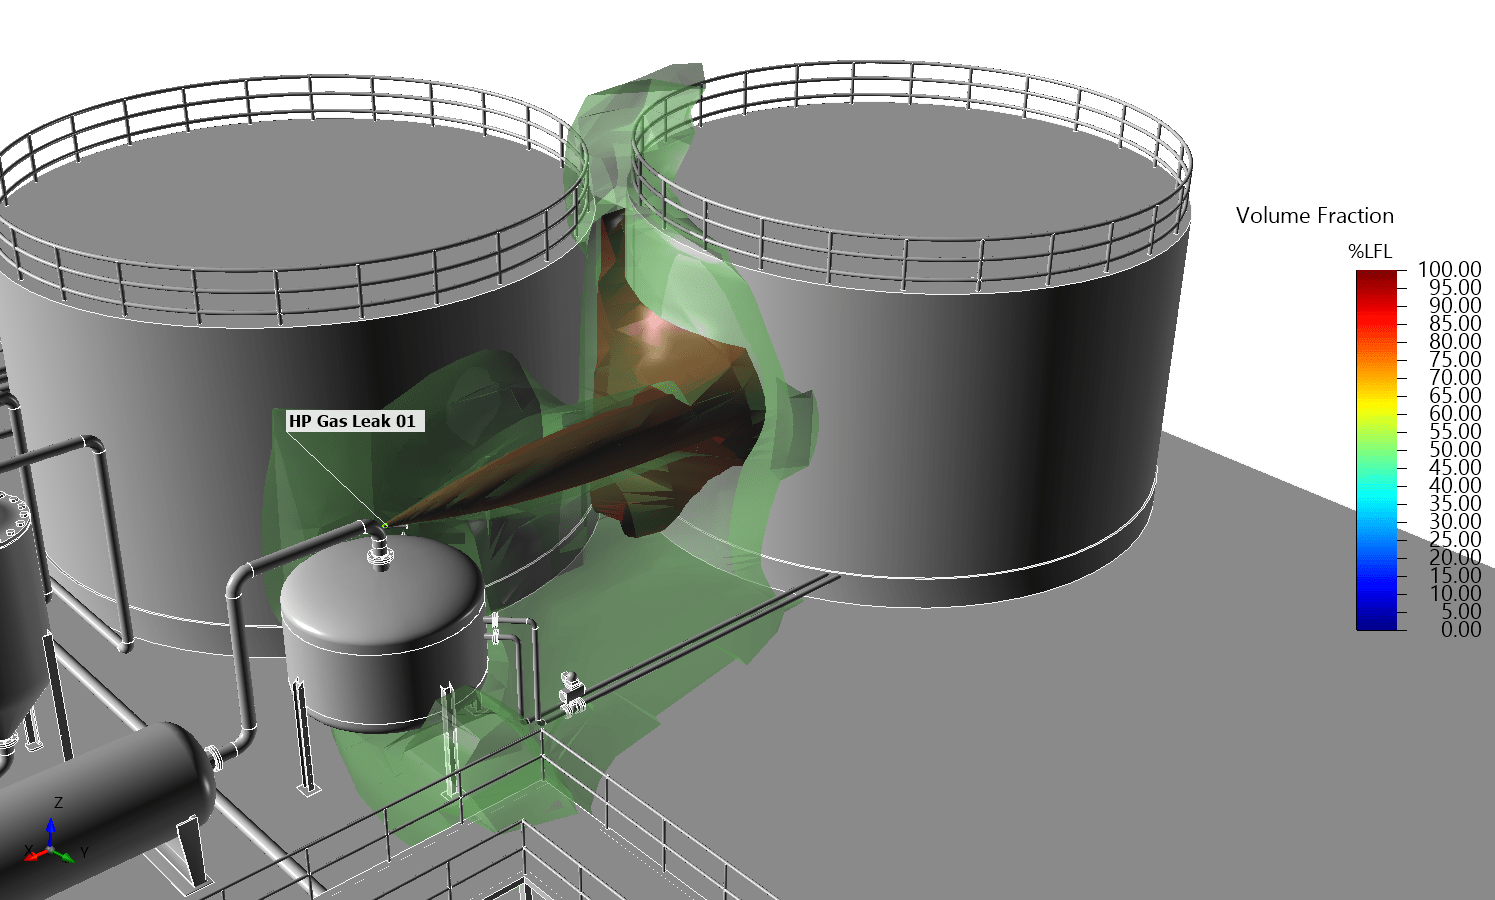
A ventilation simulation is the foundation of in:Flux dispersion analyses. The mesh from the simulation is used as a baseline for the mesh of the dispersion simulation. in:Flux can have several domain inputs, known as “inflows,” in a given simulation. An inflow is a general term that means any source of dispersed gas, such as an exhaust stack, an accidental leak from a pipe break, or an HVAC system fan. For simplicity we will start with adding a single high pressure release to the project, to simulate an accidental leak.
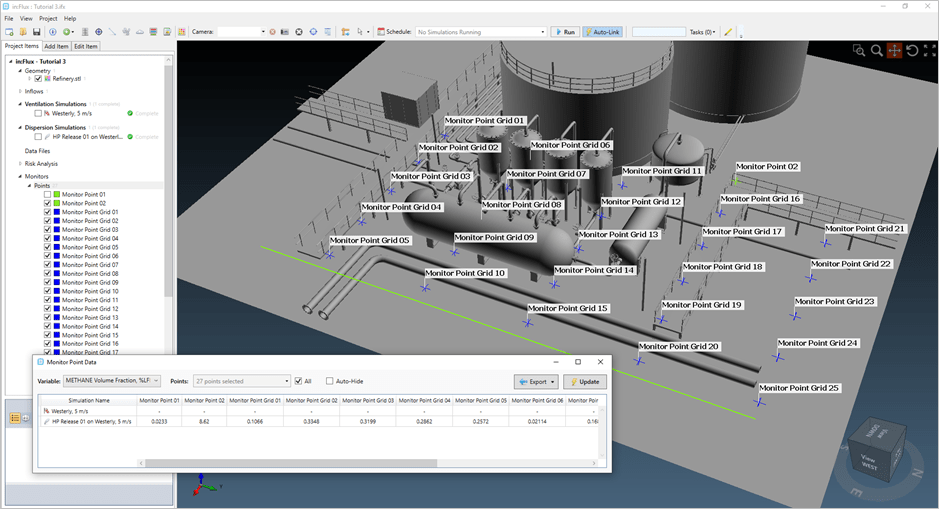
Monitor points in in:Flux are specified data points in the project which provide information about the simulation, e.g. wind velocity values, gas concentrations, temperatures, etc. Monitor points, lines and regions can be placed before a simulation has been set, while it is calculating, or after it has completed. There is no limit to the number of monitors that can be added to an in:Flux project. The monitor data can, once defined, can be exported to an excel document for further analysis.
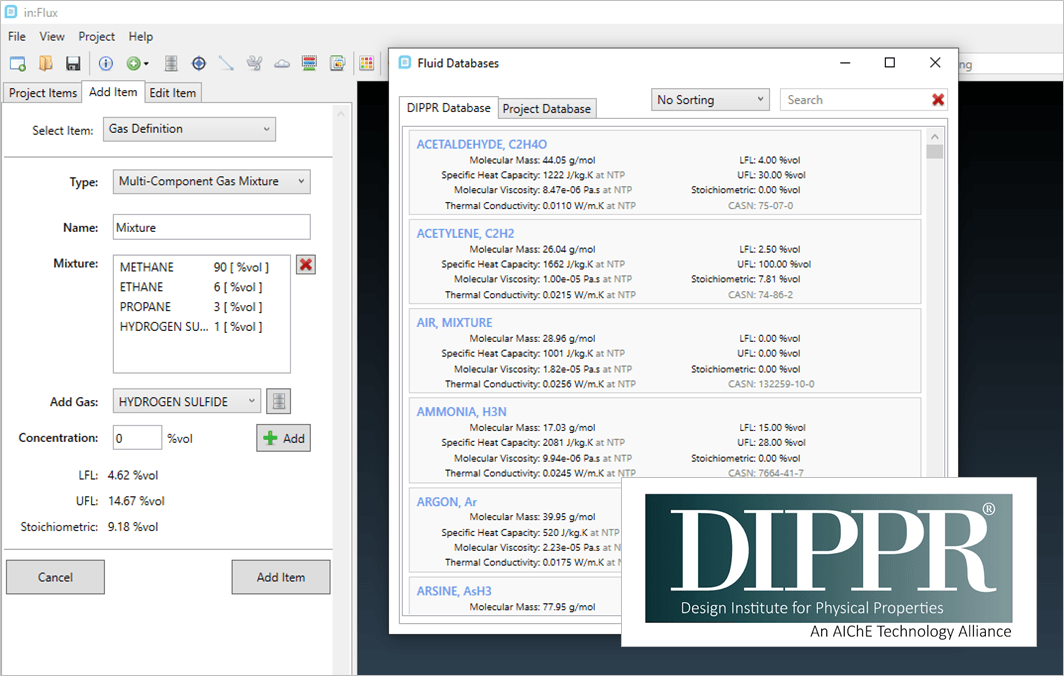
This tutorial will assist you in creation of a multi-component gas. Once added to the project database, the gas mixture can be selected for use in dispersion calculations. in:Flux comes included with the AIChE DIPPR database of chemicals for creating your multi-component gas. in:Flux tracks individual components as well as the properties of the “bulk” mixture throughout the simulation.
 Learn More
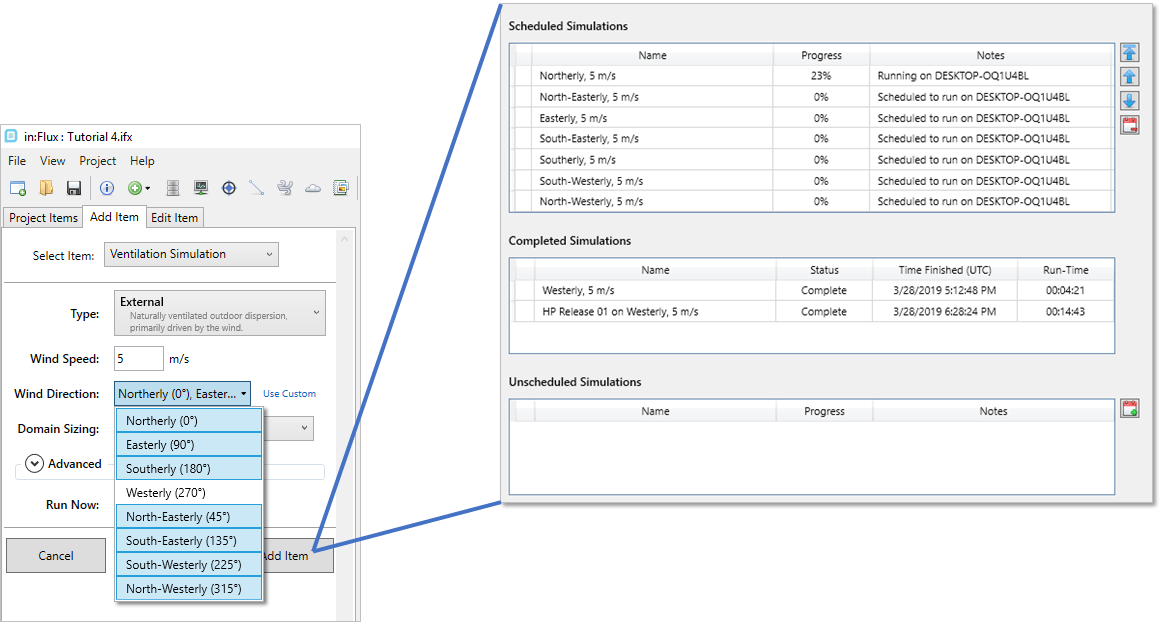
in:Flux was developed with the goal of being able to quickly and easily setup multiple CFD simulations. Additional ventilation simulations can be added with just a few clicks. Once simulations have been defined, users can ‘promote’ or ‘demote’ simulations to change the order of their calculations, via the simulation scheduler window. The next two tutorials will go over setting up and running multiple simulations as well as capabilities that can be used while simulations are running.
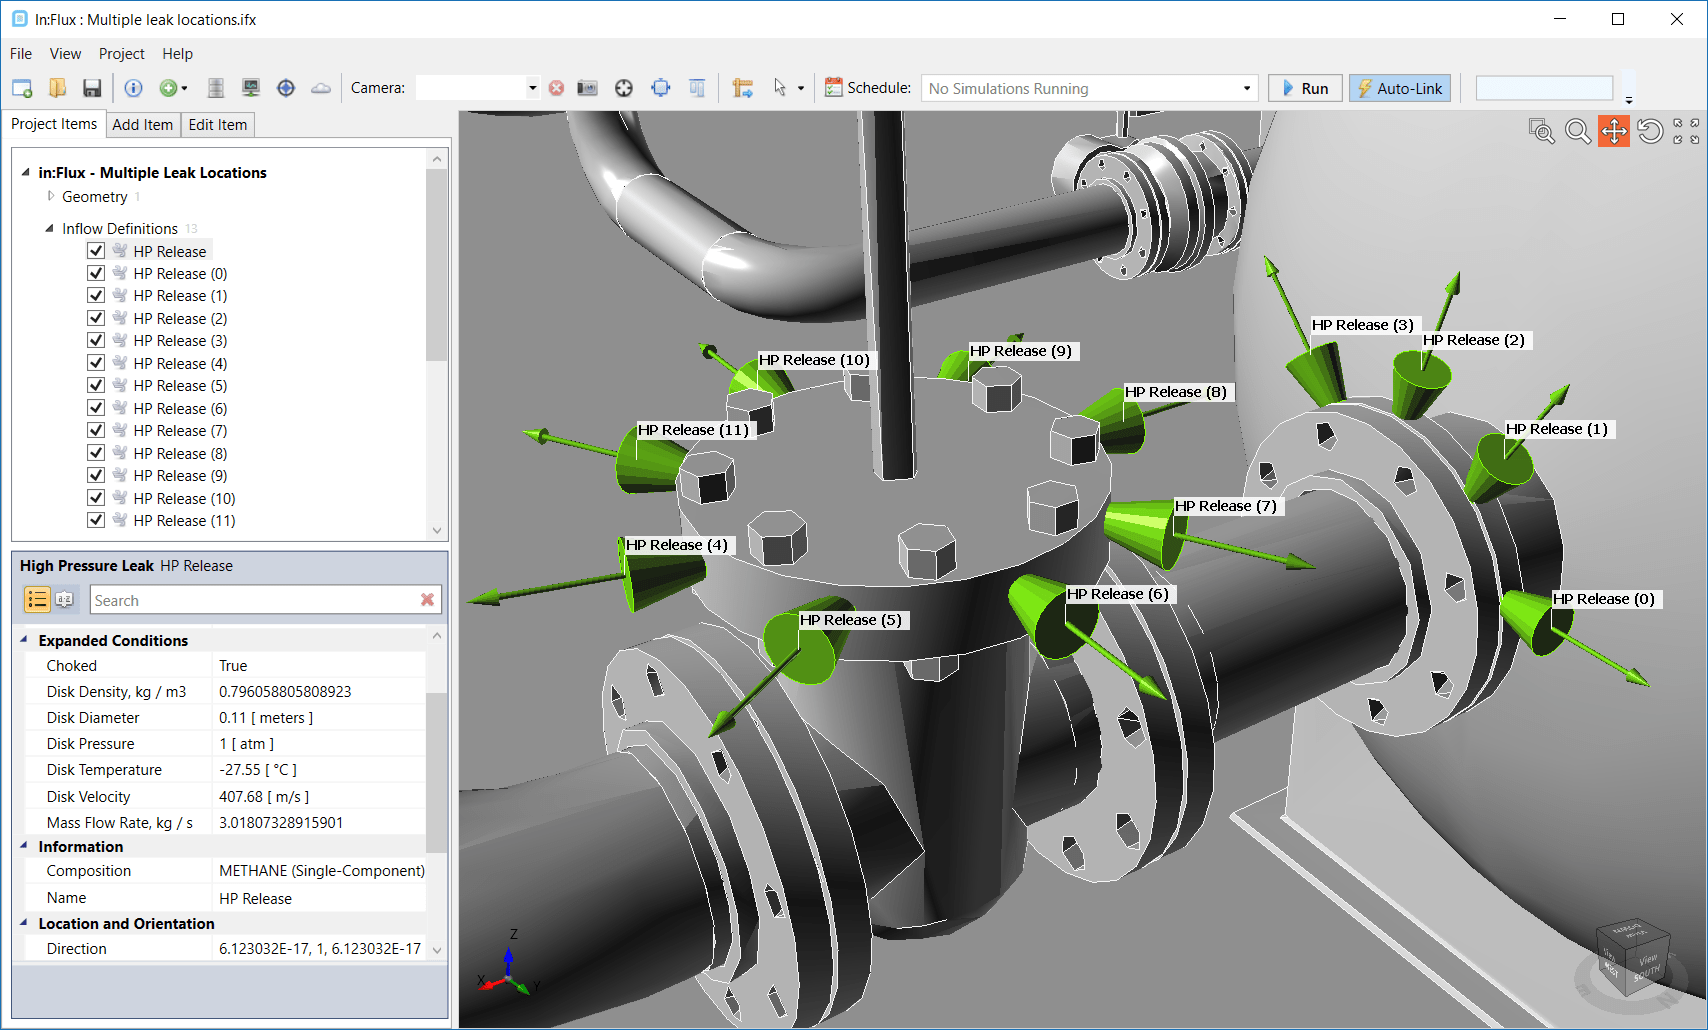
In addition to being able to quickly add multiple ventilation simulations, in:Flux has capabilities for continually adding dispersion simulations and other project items while calculations are progressing. Users can define multiple inflows (leak sources) and then add dispersion simulations to the scheduler that are made up of any combination of leak sources and ventilation simulations all while other calculations are being performed.
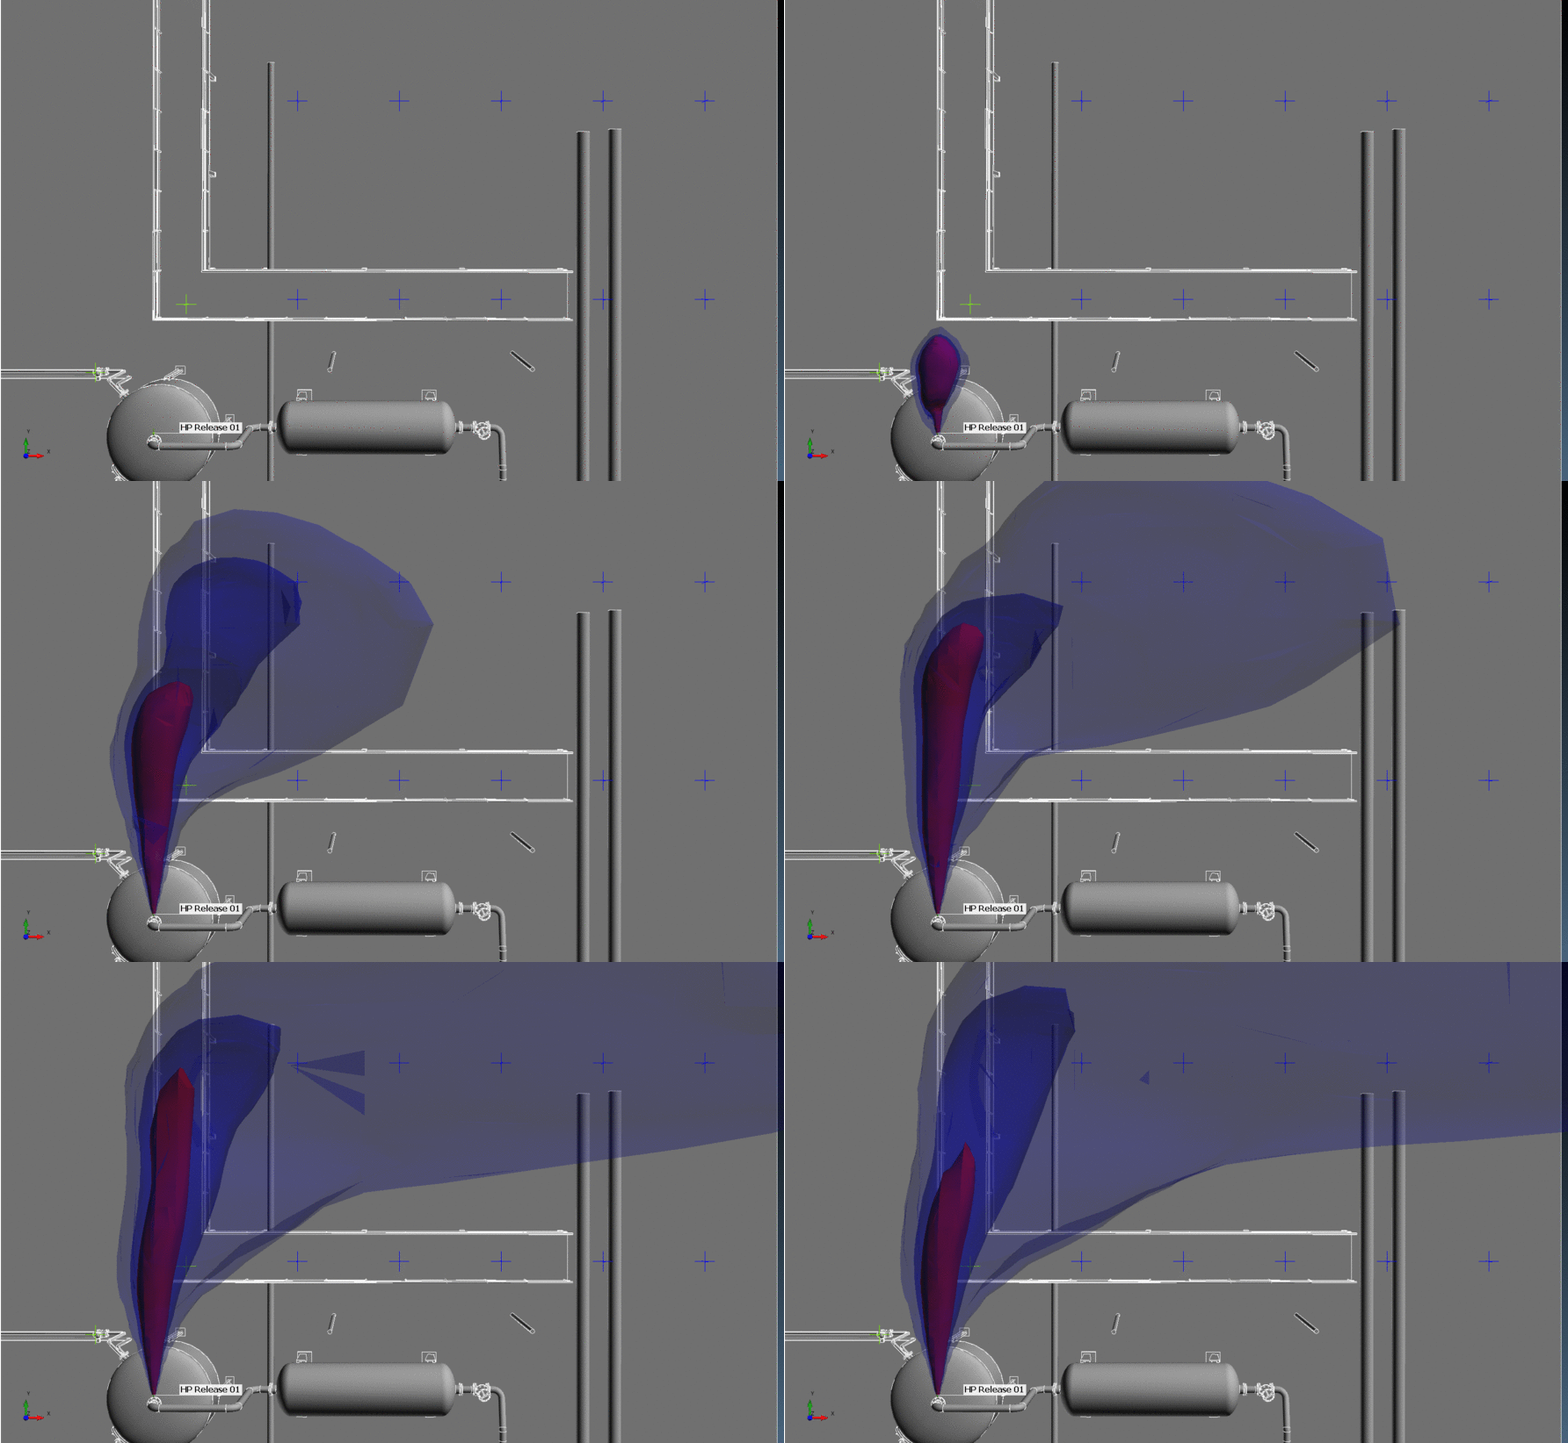
in:Flux simulations are automatically set to be steady-state. This means that there is no concept of time – all in:Flux is trying to simulate is the established gas plume as if there was unlimited inventory. In reality, there will always be a finite inventory, meaning upstream pressures will drop and flow rates will decrease until eventually no gas remains to be released. If this happens very quickly, then steady-state simulations used in the earlier tutorials are not appropriate and a transient CFD simulation is needed. A transient simulation is a time-dependent simulation where a duration is needed for the duration of the simulation. This duration depends on the application – some cases may only be for 10 seconds while others could be over 200. Looking at transient simulations allows quantified and visual outputs of what the release is doing at a certain time after the leak starts. This tutorial will go over how to view and plot the concentration of the release with time.
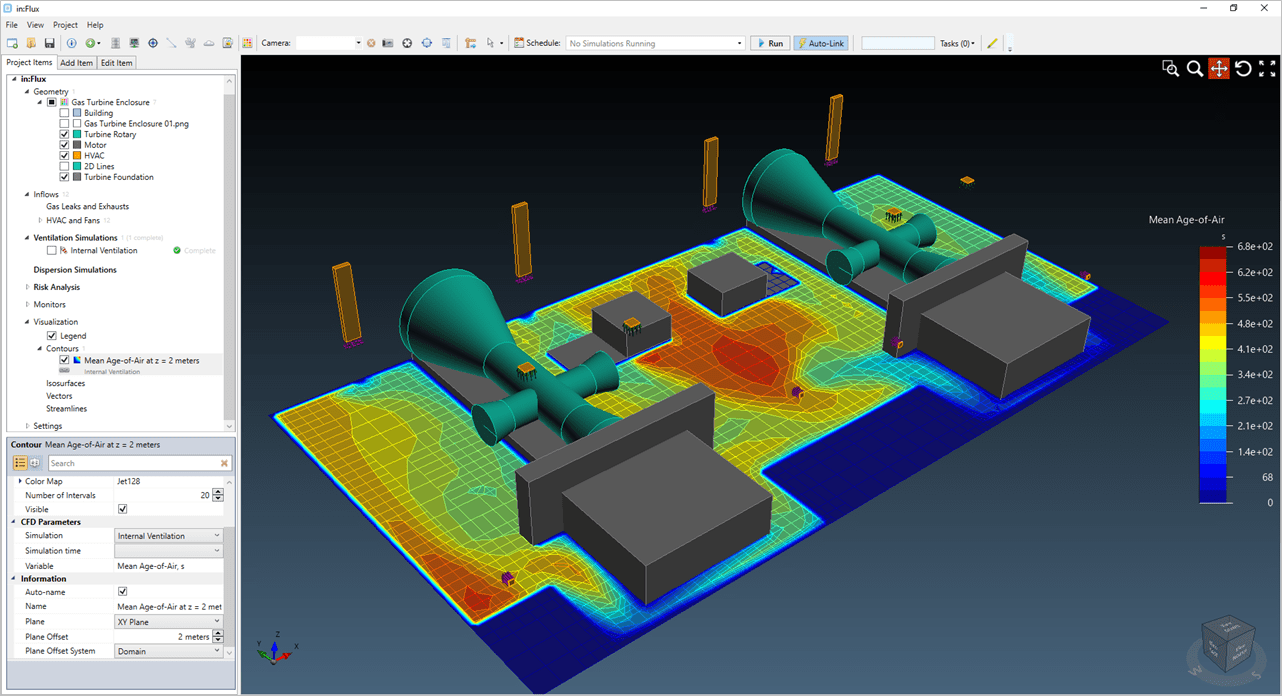
All tutorials prior to this one have used an external ventilation simulation – simulating airflow outside and around buildings or structures. This tutorial will go over how to simulate internal ventilations within buildings.This is commonly done to show compliance for gas detector placements or show a building is adequately ventilated. The tutorial will go over an example case for a gas turbine enclosure – simulating an internval ventilation and then calculating a dispersion within the building.
 Advanced
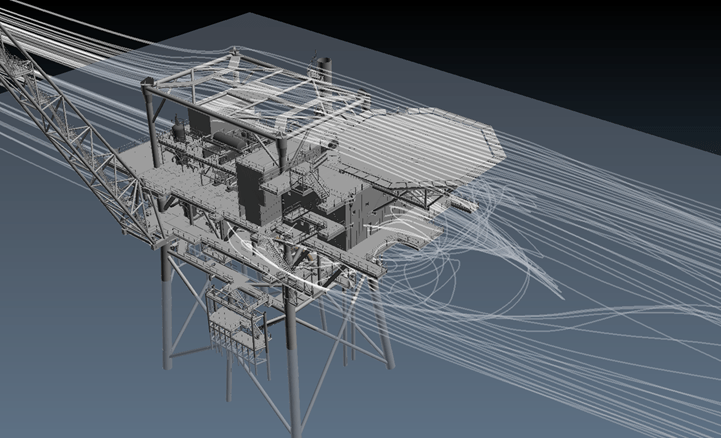
As of version 1.34, in addition to the typical SST turbulence model, in:Flux comes included with a Reynolds Stress Transport Model (RSTM) for performing helideck turbulence studies to comply with CAP437 and NORSOK C-004. The RSTM solves 7 different turbulence equations, rather than the 2-equation SST model used for standard analyses. The additional turbulence equations of the RSTM are used to solve the necessary vertical velocity fluctuations as required by CAP437. When performing these simulations a new post-processing variable called ‘Vertical Fluctuating Velocity, m/s’ will be made available. Additionally, a more sensitive mesh adaption will automatically be applied to capture the complex turbulence generation.
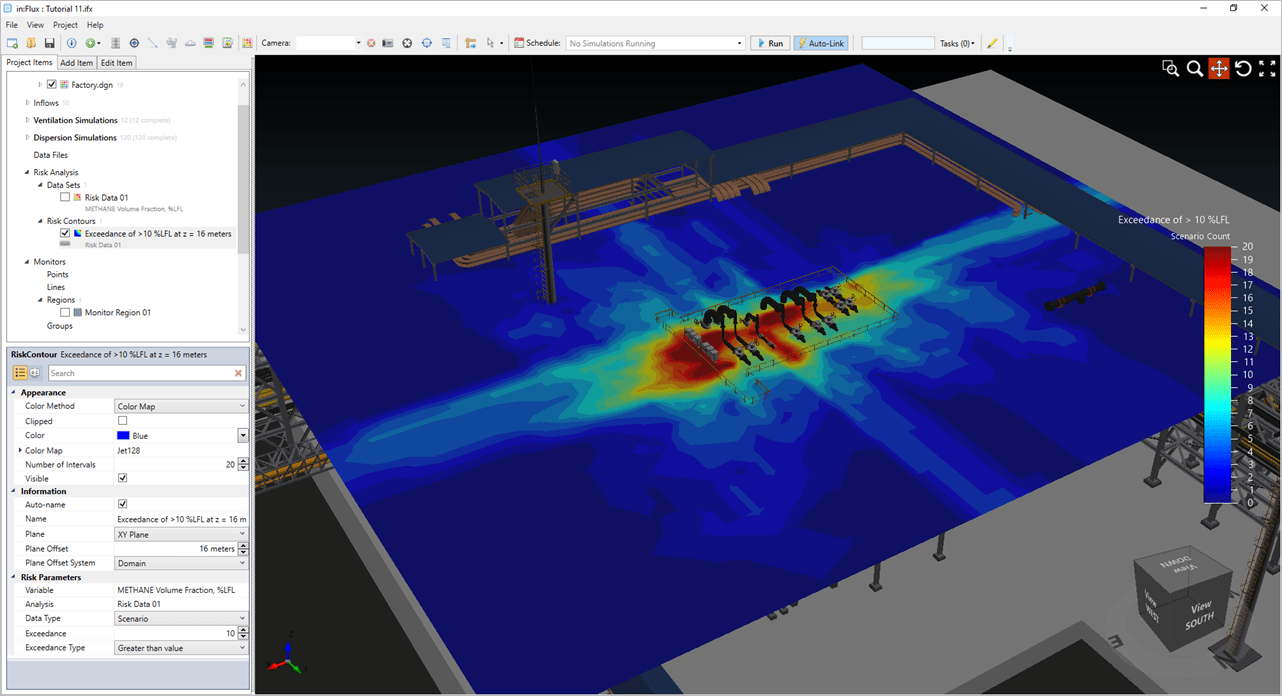
This tutorial will go over the definition of gas leaks and wind profiles containing frequency and probability data using the Risk Manager. Consequence values for each case may be entered manually or extracted from the calculated size of the flammable gas cloud. Once the defined cases have completed calculating contour plots of the risk data can be created, e.g. exceedance of 10% LFL.
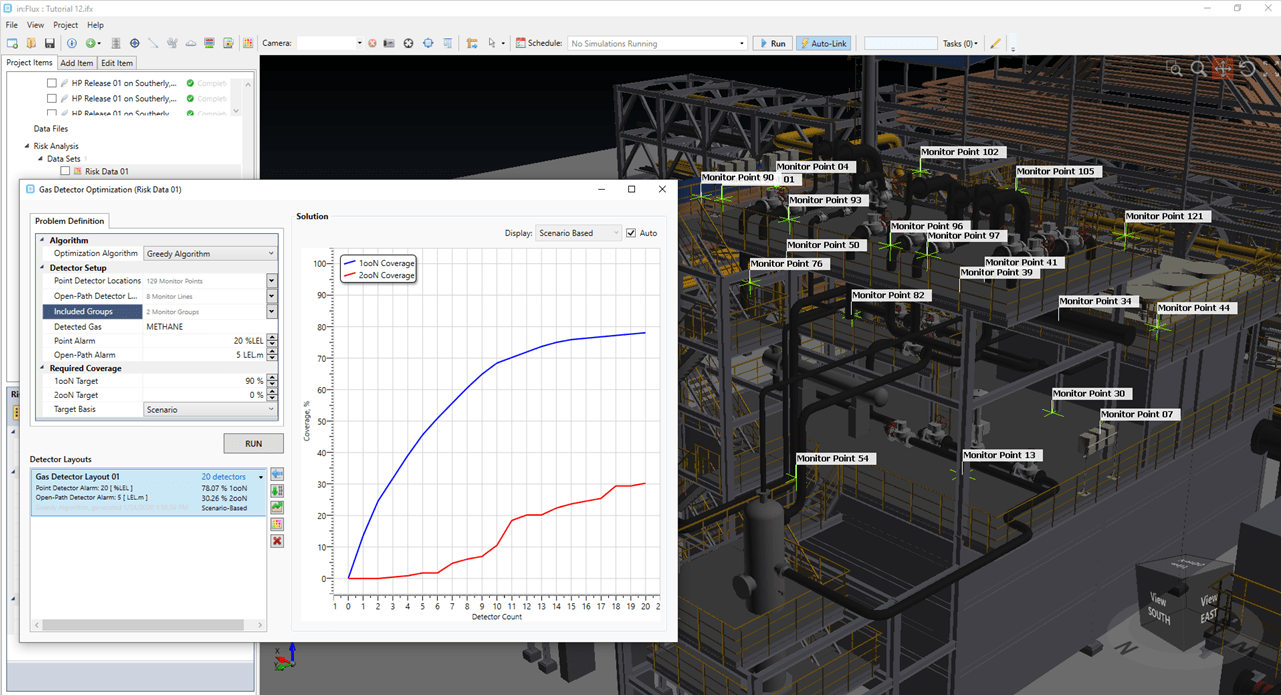
in:Flux enables users to assess and optimize gas detector positions using results of CFD simulations as well as risk data. Using some of the results from Tutorial 11, this tutorial will generate an optimized detector layout based on the risk data set and defined plausible point and open path gas detectors. The optimization will review the results in three ways: based on scenario data, based on frequency data and based on risk data.
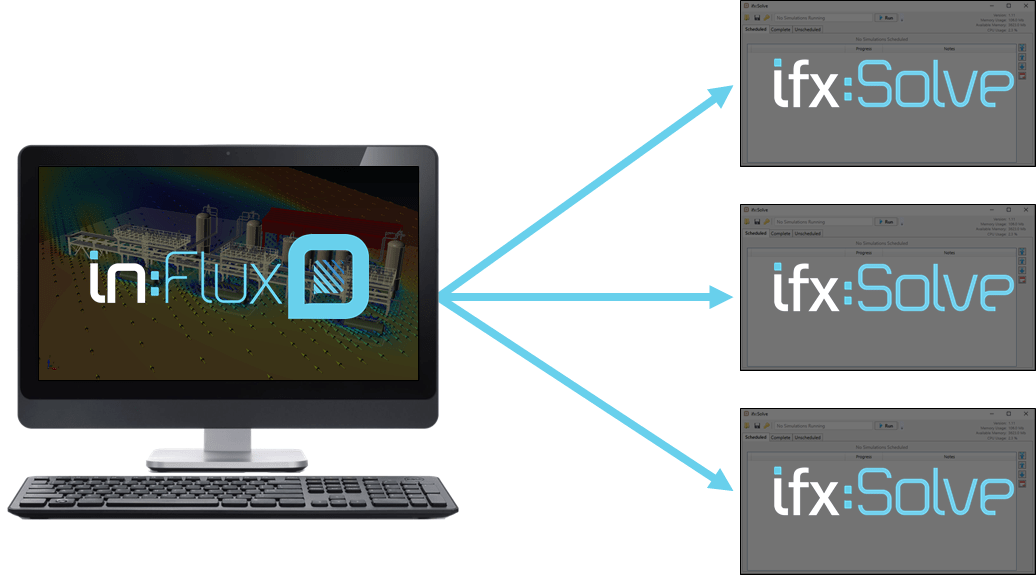
Very large projects can now be split into multiple “Solver Files” for distributed computing. The solver files can either be loaded into separate instances of in:Flux or in the new IFX-Solve software. Saved data can be referenced in the solver files without having to combine them back into a single large file. Using this method can enable users to complete 3000 CFD simulations in less than 6 days. This guide will go over how to create Distributed Solver Files and run them on either in:Flux or ifx:Solve.
Downloads
PDF versions of downloadable documents for common technical support requests and User Guide information.
Webinar Recordings – Coming Soon
Check back later to be notified about our first webinar discussing the future of the fire and gas mapping industry as well as future capabilities of Detect3D and in:Flux. After the webinar sessions, recordings will be provided here to stream or download.

