CFD Modeling
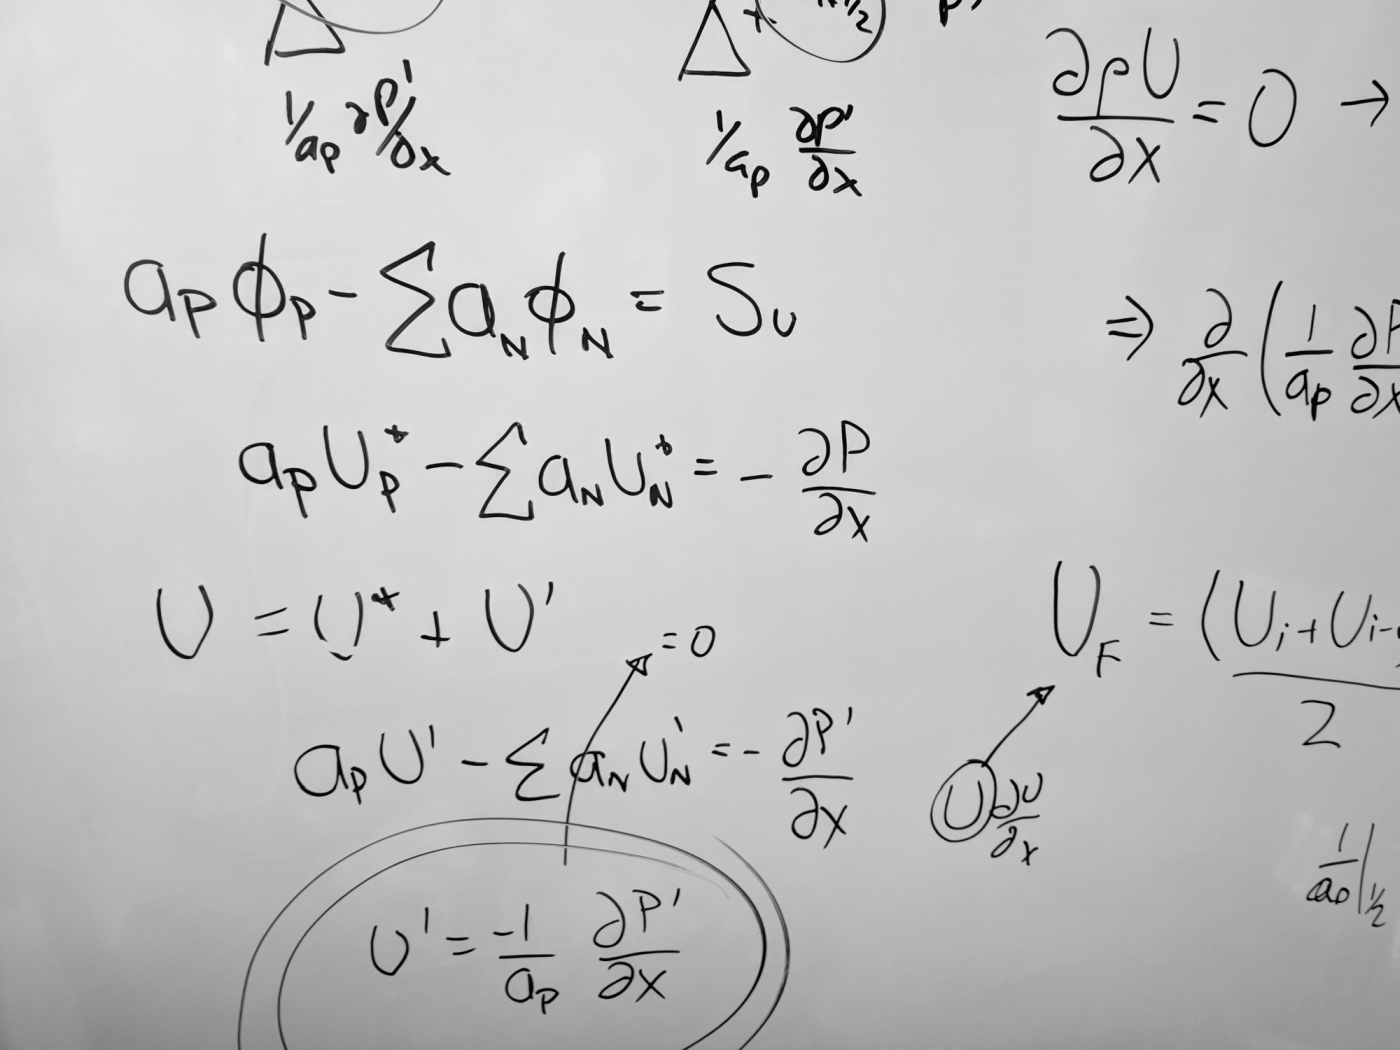
 in:Flux is an advanced Computational Fluid Dynamics (CFD) software that simulates ventilation and dispersion in complex geometries by solving the 3D Reynolds-Averaged Navier Stokes (RANS) equations. It includes a level of automation that is virtually unheard of in traditional CFD software – all domain sizing, meshing, numerical setup and solution monitoring is handled automatically, meaning that the software can be used by the CFD experts and non-experts alike. With just a few clicks, hundreds of CFD simulations can be scheduled to run. Thanks to the compact mesh adaption, simulations usually complete in just a few minutes even for highly complex geometries.
Ventilation and Dispersion
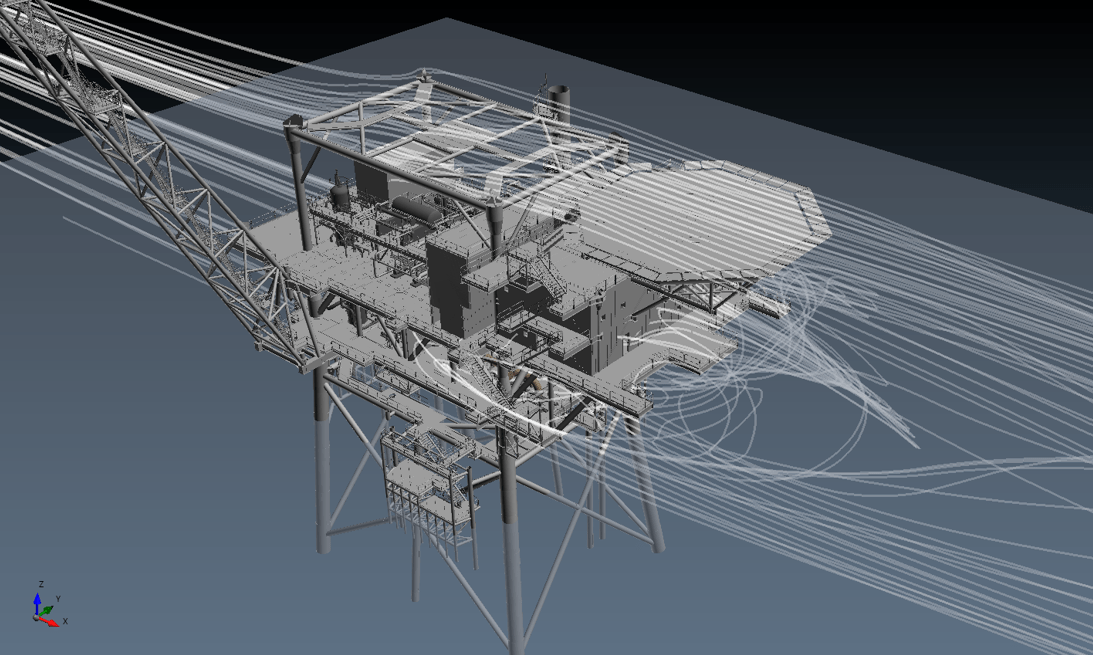
 Running ventilation and dispersion simulations in in:Flux is easy. Once a CAD file has been imported, the user simply selects the wind direction and speed, and the software handles the rest. In this way, multiple ventilation cases can be set up in seconds, and the scheduler runs the first simulations immediately.
While the ventilation simulations are running, “inflows” can be defined representing high pressure gas leaks, controlled blowdown events or exhaust emissions. The locations of the inflows are set by clicking on the CAD file. The properties of the inflow, such as velocity, temperature and composition, can either be specified directly, or using the in-build isentropic expansion calculator for high pressure leaks. Setting up dispersion simulations is a simple operation: just select the inflows and select the ventilation, and in:Flux will automatically set up the dispersion cases. This process can occur while the ventilation simulations are running, and the new dispersion simulations will automatically start once the ventilation has complete.
When the simulations are converged, the results can be visualized using contours, streamlines, vectors and isosurfaces. Images can be output directly or to the clipboard, enabling simple reporting. Further processing is available using monitor points and regions, and the results are exportable to Excel.
Automatic Meshing and Domain Sizing
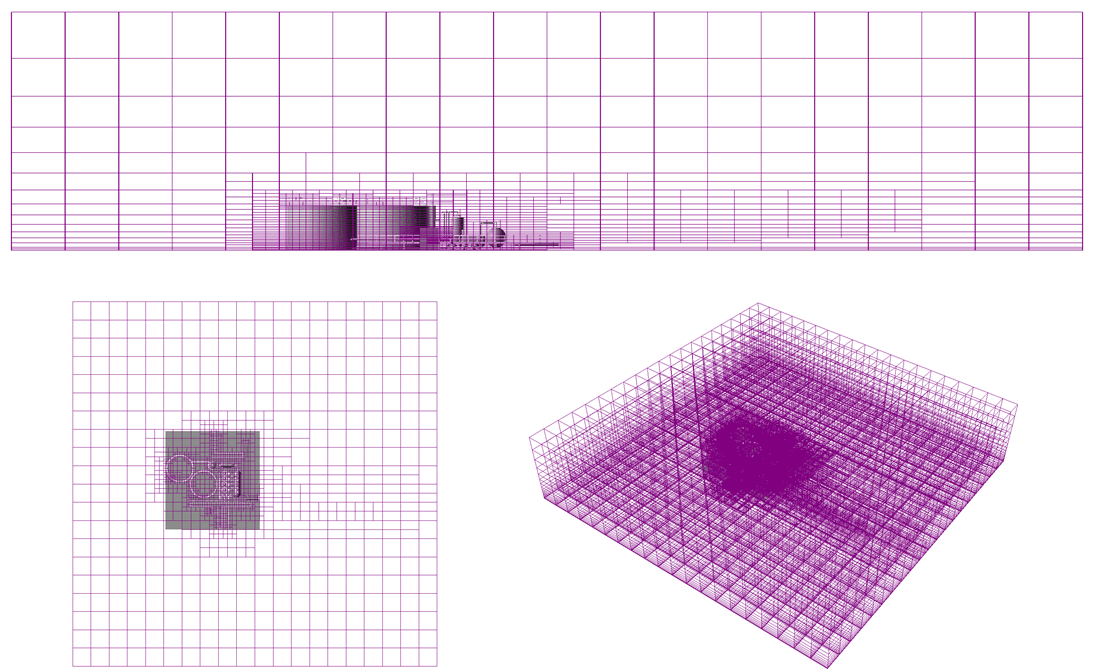 Creating a mesh for CFD simulations is normally a laborious process and can take hours with traditional CFD software, but with in:Flux it is done automatically in seconds. To size the domain that contains the mesh, the CAD geometry is analyzed to determine the size of obstructing features in the direction of the wind. Based on this analysis, the domain is expanded around the geometry such that the sides of the domain are positioned optimally. The mesh is then established by successive refinements around the CAD, including boundary layer grading close to the bottom wall. None of this requires any user interaction or setup.
When the simulation is running, in:Flux analyzes the regions of high gradients and automatically refines the mesh so that the accuracy is improved. Conversely, where the mesh contains too much refinement relatively to the gradients, it will the mesh will coarsen. This redistribution of mesh density ensures that the solver converges on accurate solutions with appropriately refined grids.
Automatic Numerical Setup
 The appropriate numerical setup for CFD modeling of ventilation and dispersion have been well established, and are automated in in:Flux to ensure the highest quality solutions. The boundary conditions are set such that the upstream face uses a logarithmic expression for the Atmospheric Boundary Layer (ABL), while the remaining boundaries are zero-pressure openings except for the bottom boundary which is a wall. CAD geometry is accounted for using the Immersed Boundary Method (IBM).
All terms of the governing equations are discretized using at least second-order accuracy, with the UMIST TVD scheme providing second-order accuracy for the convection term. Closure of the RANS equations is provided using the SST Turbulence Model. Buoyancy forces are included in the momentum equations, and turbulence production from buoyancy is included in the k-equation.
All of this setup is performed in the background by default and does not require any interaction or choices from the user. This makes in:Flux accessible to the non CFD expert, as high quality numerical setup is the normal mode of operation.
Multi-Component Releases and AIChE® DIPPR® Fluids Database
 Simulated gas leaks can be setup as pure or multi-components gases. There is no limit to the number of components can be specified. Properties of the multi-component gas, such as the LFL, UFL and Stoichiometric concentrations, are automatically calculated. In addition, multiple gas mixtures can be specified in a single simulation, which may be useful for modeling controlled blowdown events. The DIPPR® fluids database provides a comprehensive set of gases to choose from – the user can also create their own gases if needed.
Simulation Scheduler
 in:Flux automatically handles the scheduling of simulations, allowing the user to set up hundreds of CFD simulations without the need for writing complex scripts or batch files. By default, simulations are queued such that one will start when the previous one completes. The user can prioritize simulations if results are required early. The scheduler can be started or stopped at any time.
Post-processing
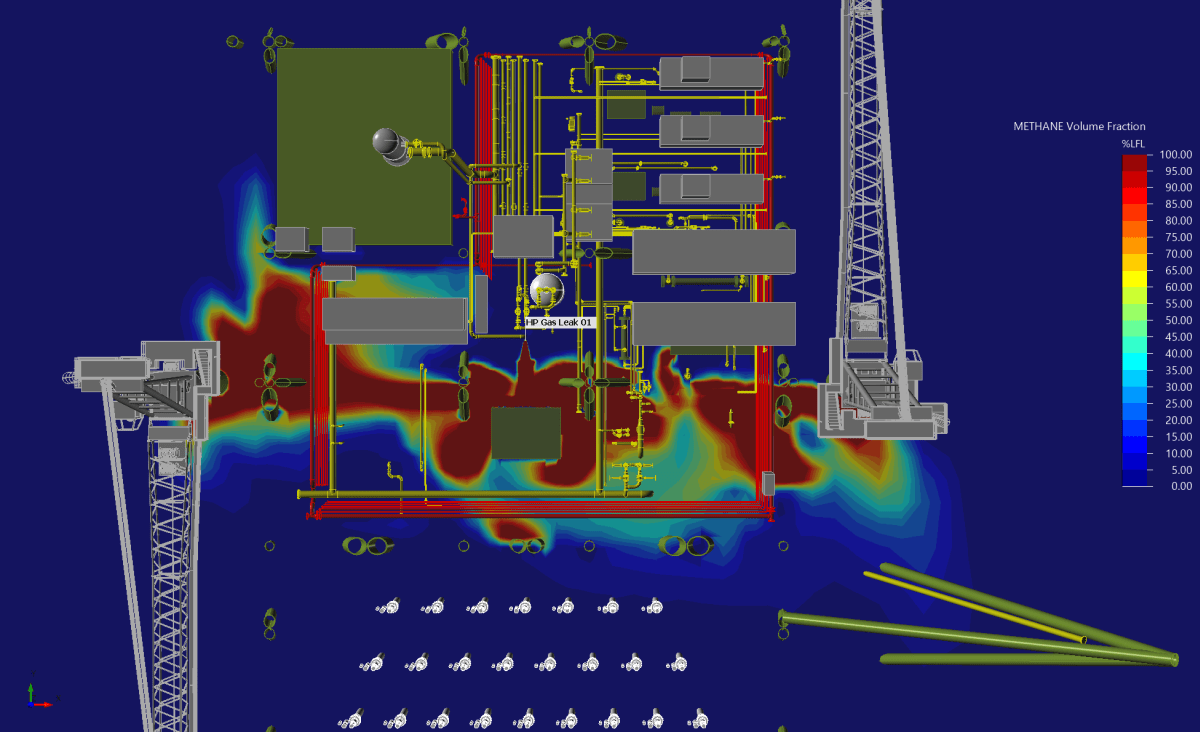
 A wide range of visualizations are included with in:Flux, including contours, vectors, streamlines and isovolumes. These provide immediate insight into flow in the domain, whether for ventilation or dispersion. Many variables are available automatically for ease of use. For example, mean age-of-air contours and isosurfaces show regions of poor ventilation for worst-case gas leaks. For dispersion, gas concentrations can be shown either by percent volume, or by percent LFL or UFL.
Monitor Points and Regions
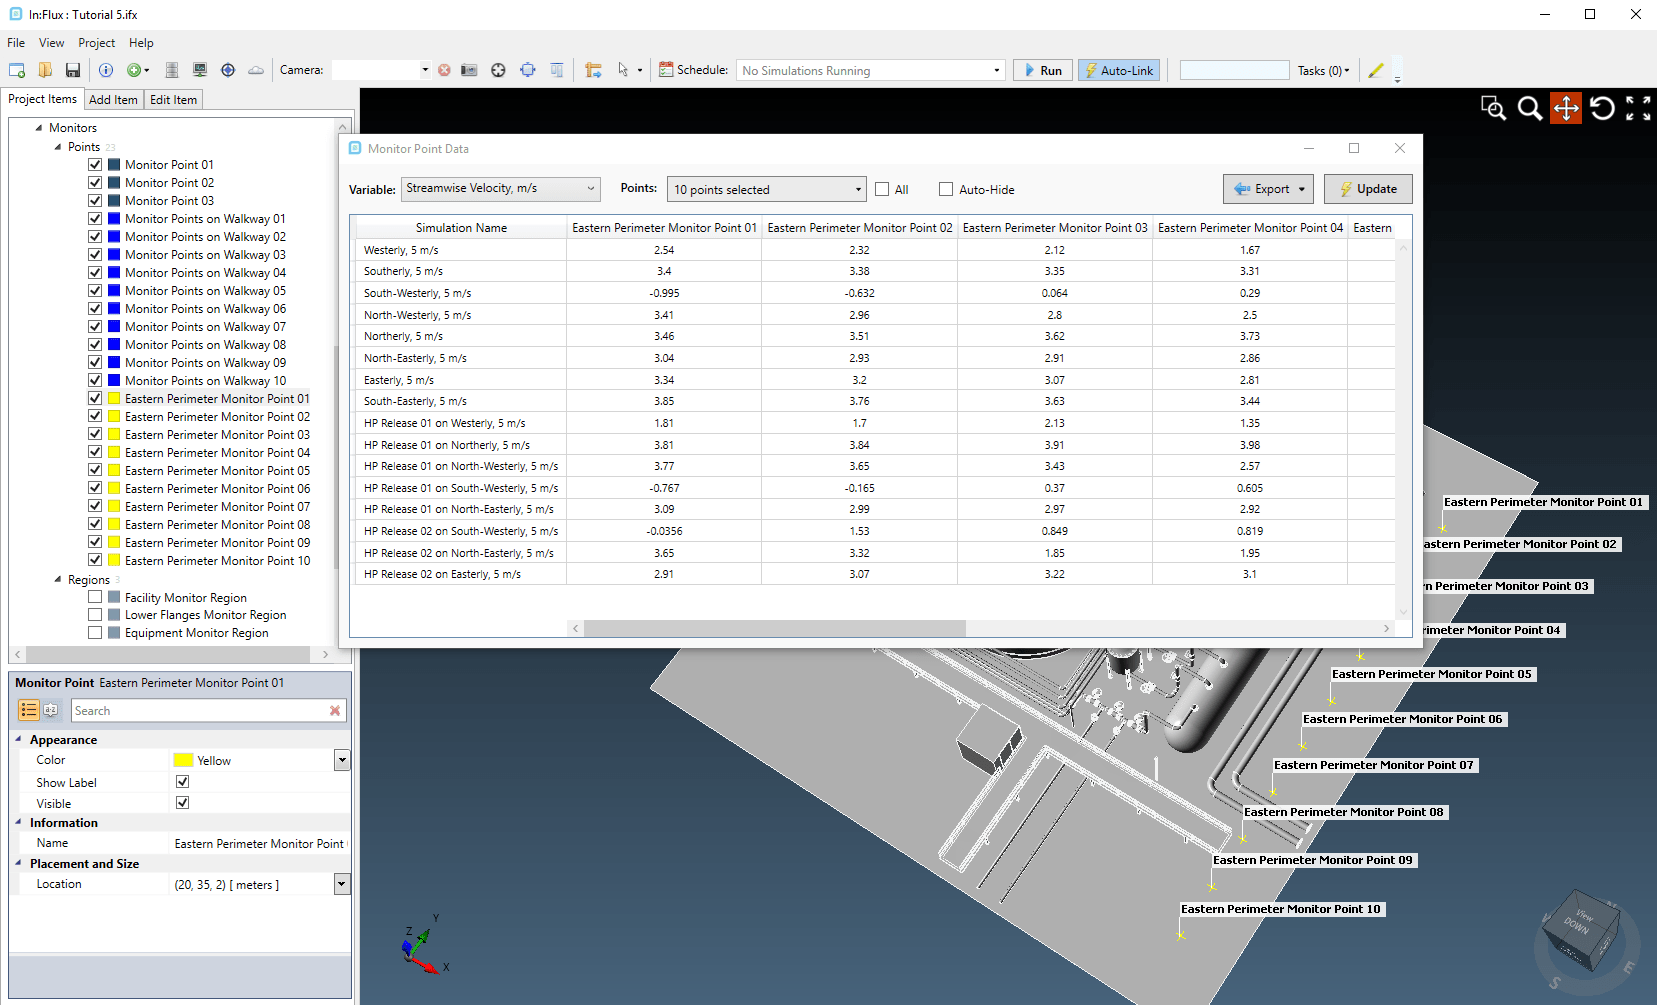 Monitor points and regions can be added to the in:Flux project at any time. By opening the monitor point analysis window, users have easy access to any variable for all the monitor points. This feature is extremely useful for gas detection, or scenarios based gas mapping studies, as the monitor points can show the gas concentration for each dispersion simulation. Monitor regions provide information about gas volume and mass, and can be used for sizing gas clouds for explosion studies or geographic gas mapping. All data collected in the monitor points and regions can be exported to Excel for further processing.
CAD Integration
 in:Flux uses the same powerful CAD importer as Detect3D, supporting the integration of Microstation® (DGN), Navisworks files (via the DWF importer), Autodesk AutoCAD® (DWG, DXF), STEP, IGES, OBJ and STL files. The DGN file format is available as an export option from PDMS software and SmartPlant. CAD objects can be edited and created in the software, either using the 3D interface, or built up from 2D CAD files and images. The import of very complex CAD files is fast even for full models of onshore or offshore facilities.
Risk-Based Gas Mapping
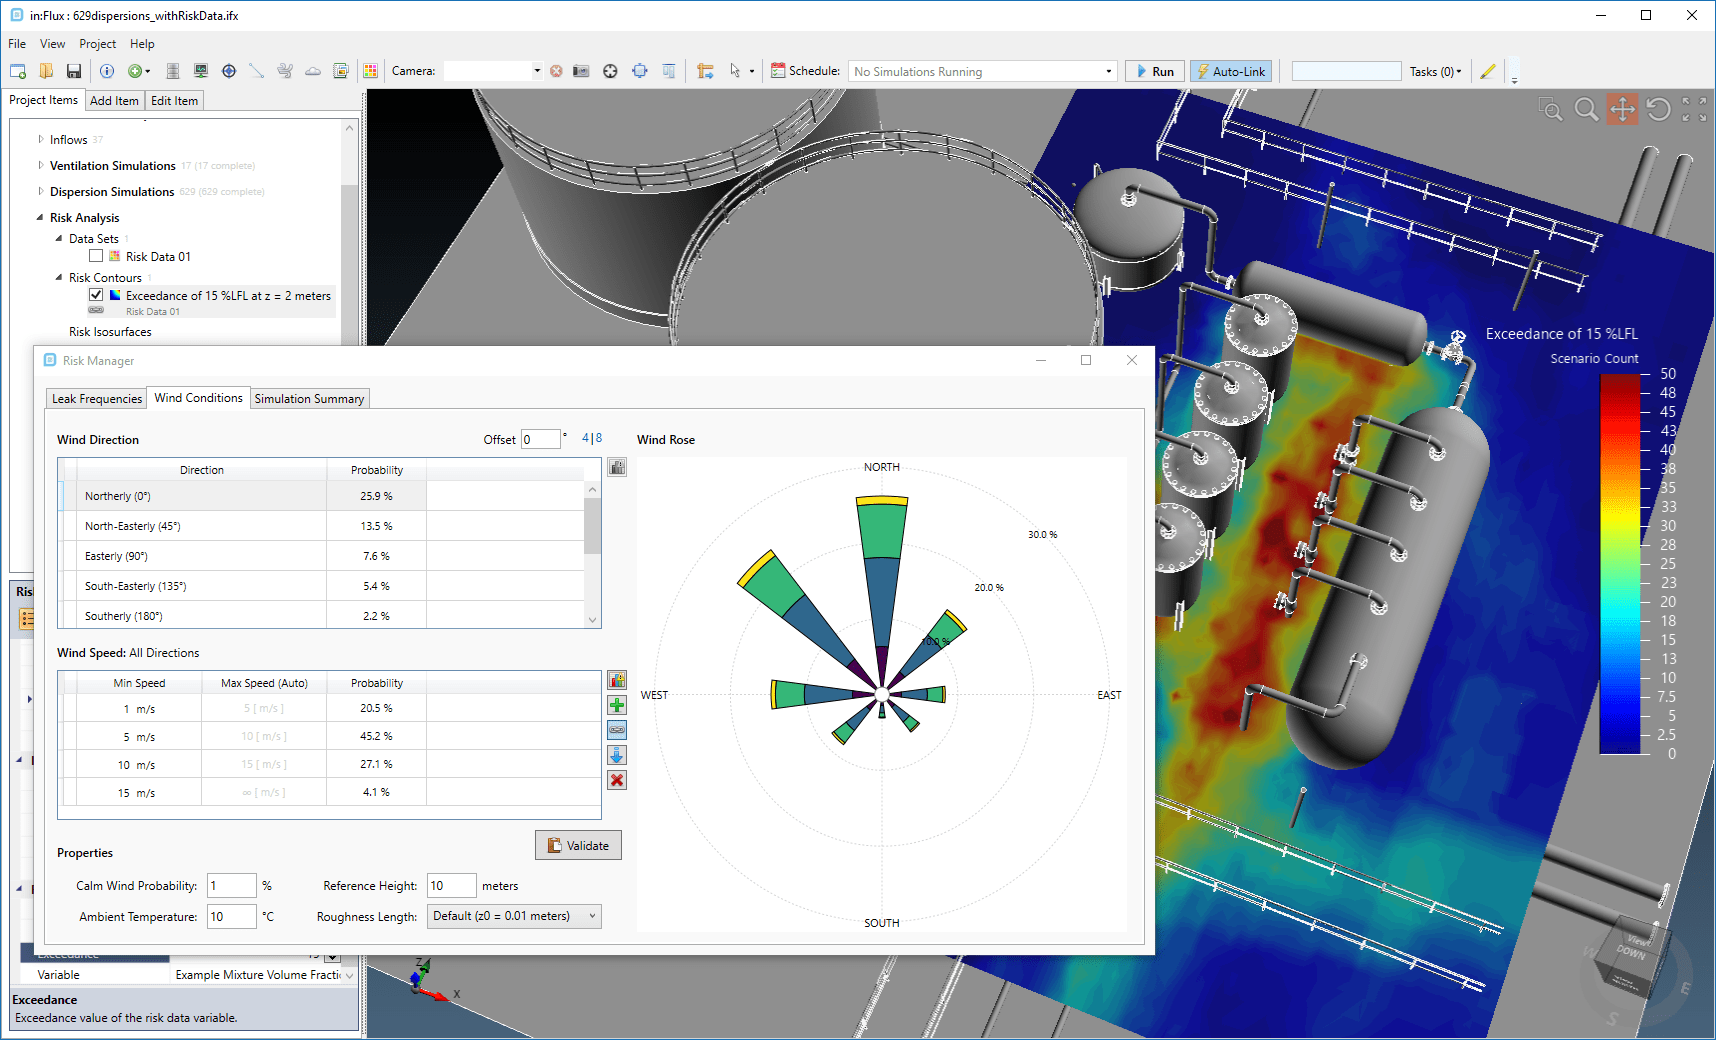 With the release of in:Flux v1.20 in January 2019, users can easily perform Risk-Based Gas Mapping studies by assigning leak frequencies to inflows as well as wind rose probability data. The combination of all cases with their associated probabilities generates a matrix of simulations, each with a scenario frequency. in:Flux automatically sets-up, generates, and runs all the simulations in the matrix. 1000 CFD simulations takes less than 7 days to complete. Once the simulations have completed, consequence values are generated from resulting gas cloud volumes and the risk for each case simulated is calculated. Risk-based visualizations, such as exceedance of gas concentrations can then be displayed with contours or isosurfaces.
Gas Detector Optimization
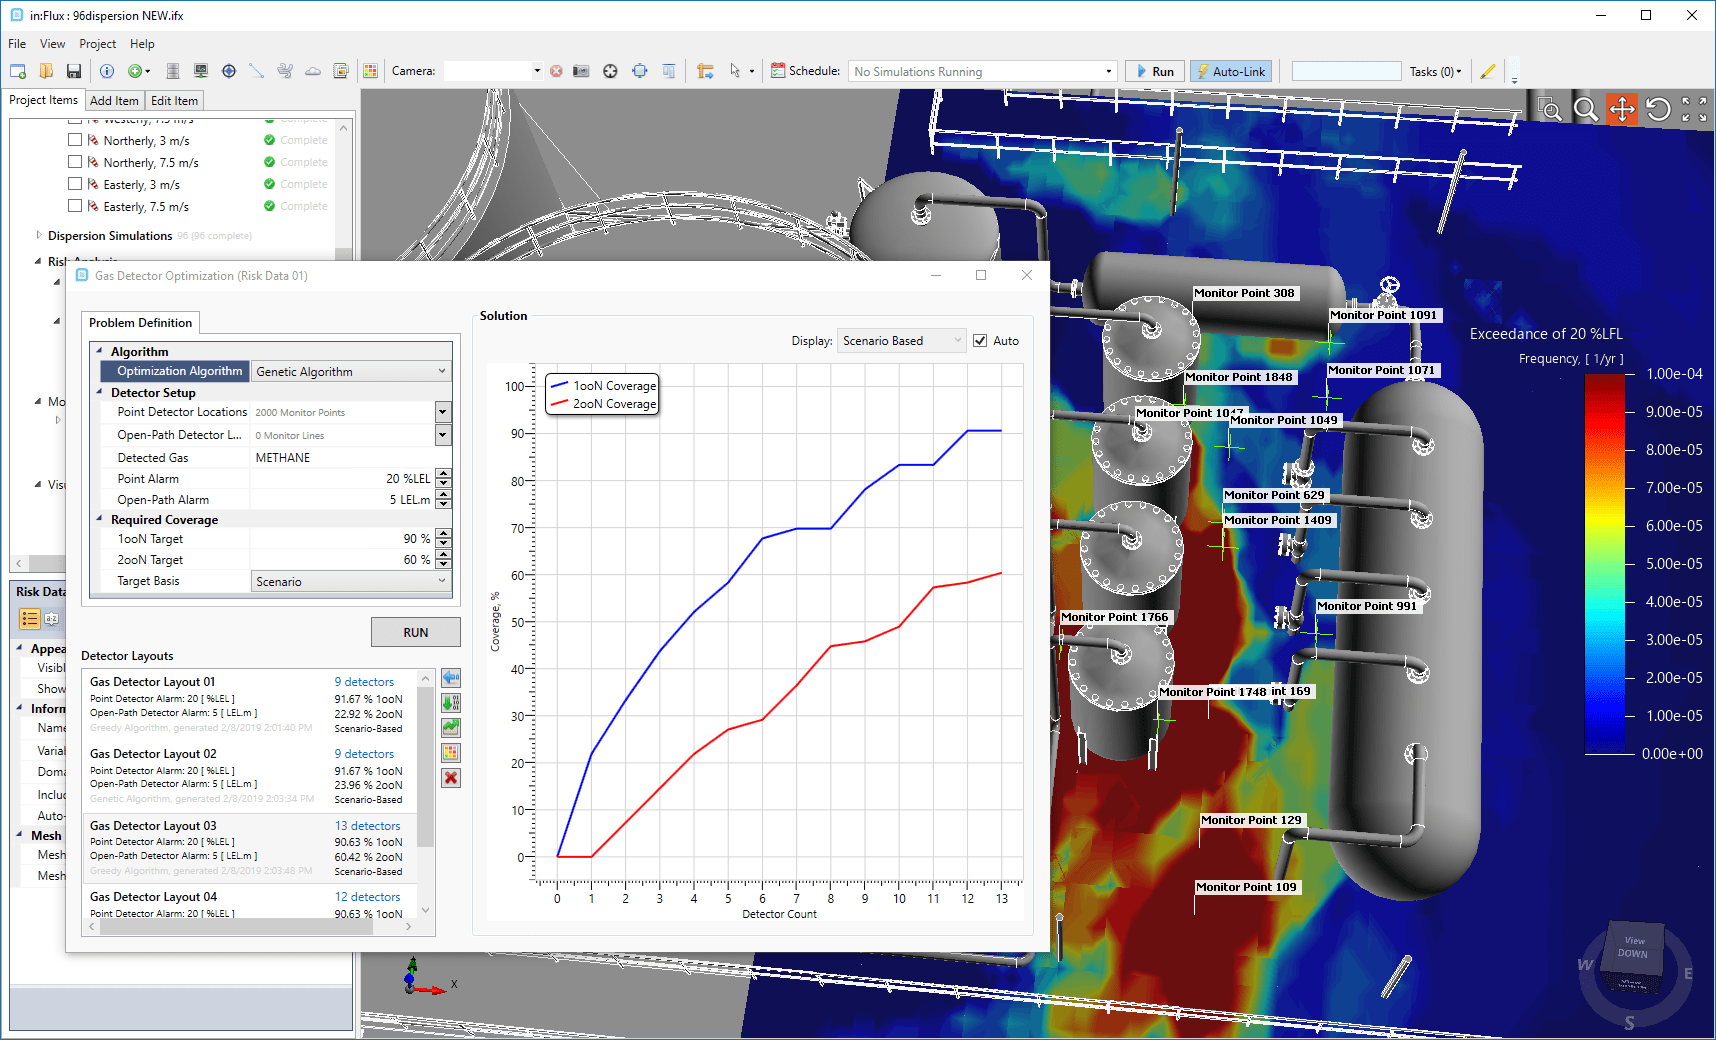 Using the completed risk data and frequency matrix as a foundation, gas detector optimizations can be run to minimize detector counts while providing appropriate coverage. Optimizations can be performed using the Greedy and Genetic algorithms for both point and open-path gas detectors. Once the risk matrix has been calculated and potential gas detector locations defined, many different layouts can be generated (in just a few seconds), to compare variables such as performance target and alarm settings. in:Flux users can perform this analysis at a fraction of the time and costs normally associated with this approach. Optimized gas detector layout can be exported to Excel or Detect3D (.d3d) project files. The Risk-Based Gas Mapping analysis does not require any expertise in CFD, and typical setup times are less than 1 hour.
Fire Modeling
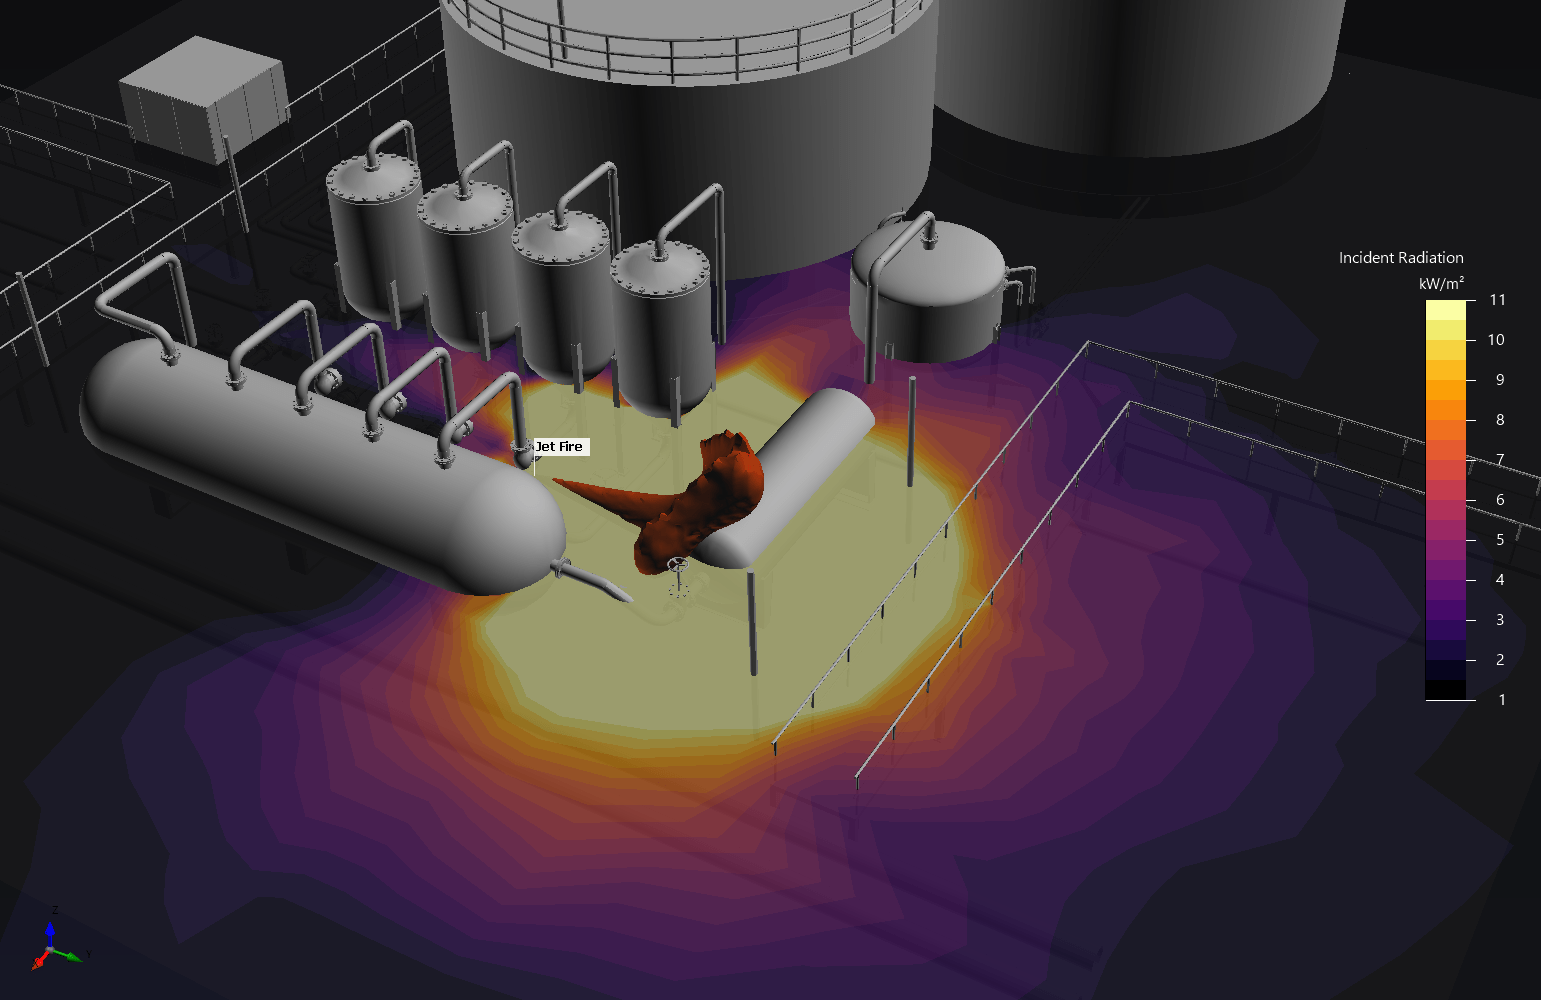 Jet and pool fires can be modeled using high pressure gas leaks or evaporating pool inflows, respectively. Both transient and steady-state simulations can be run for internal and external ventilation cases. Analyze radiation, temperature, soot and product formation variables with the standard post-processing options. Using the risk manager, exceedance contours can be generated using results from 1000s of fire simulations.
Exceedance Curves
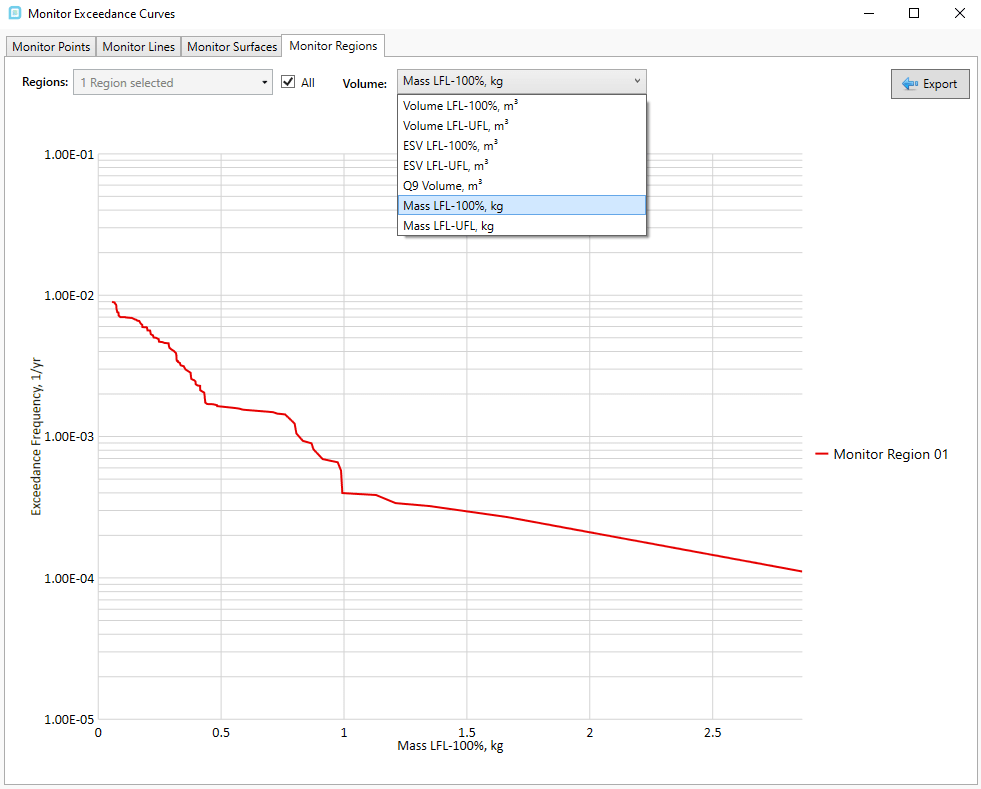 Exceedance curves can be plotted for various results. This capability is available for any monitor type in in:Flux (point, line, surface, region). The variables used for the exceedance curve are monitor specific, e.g. monitor regions show gas cloud volumes.
Helideck Turbulence Capabilities
 in:Flux comes included with a Reynolds Stress Transport Model (RSTM) for performing helideck turbulence studies which can be used to comply with regulations like CAP437 and NORSOK C-004.
Once a simulation has been defined using the RSTM a new post-processing variable (Vertical Fluctuating Velocity, m/s) will be available. Additionally, a more sensitive mesh adaption will automatically be applied to capture the complex turbulence generation.