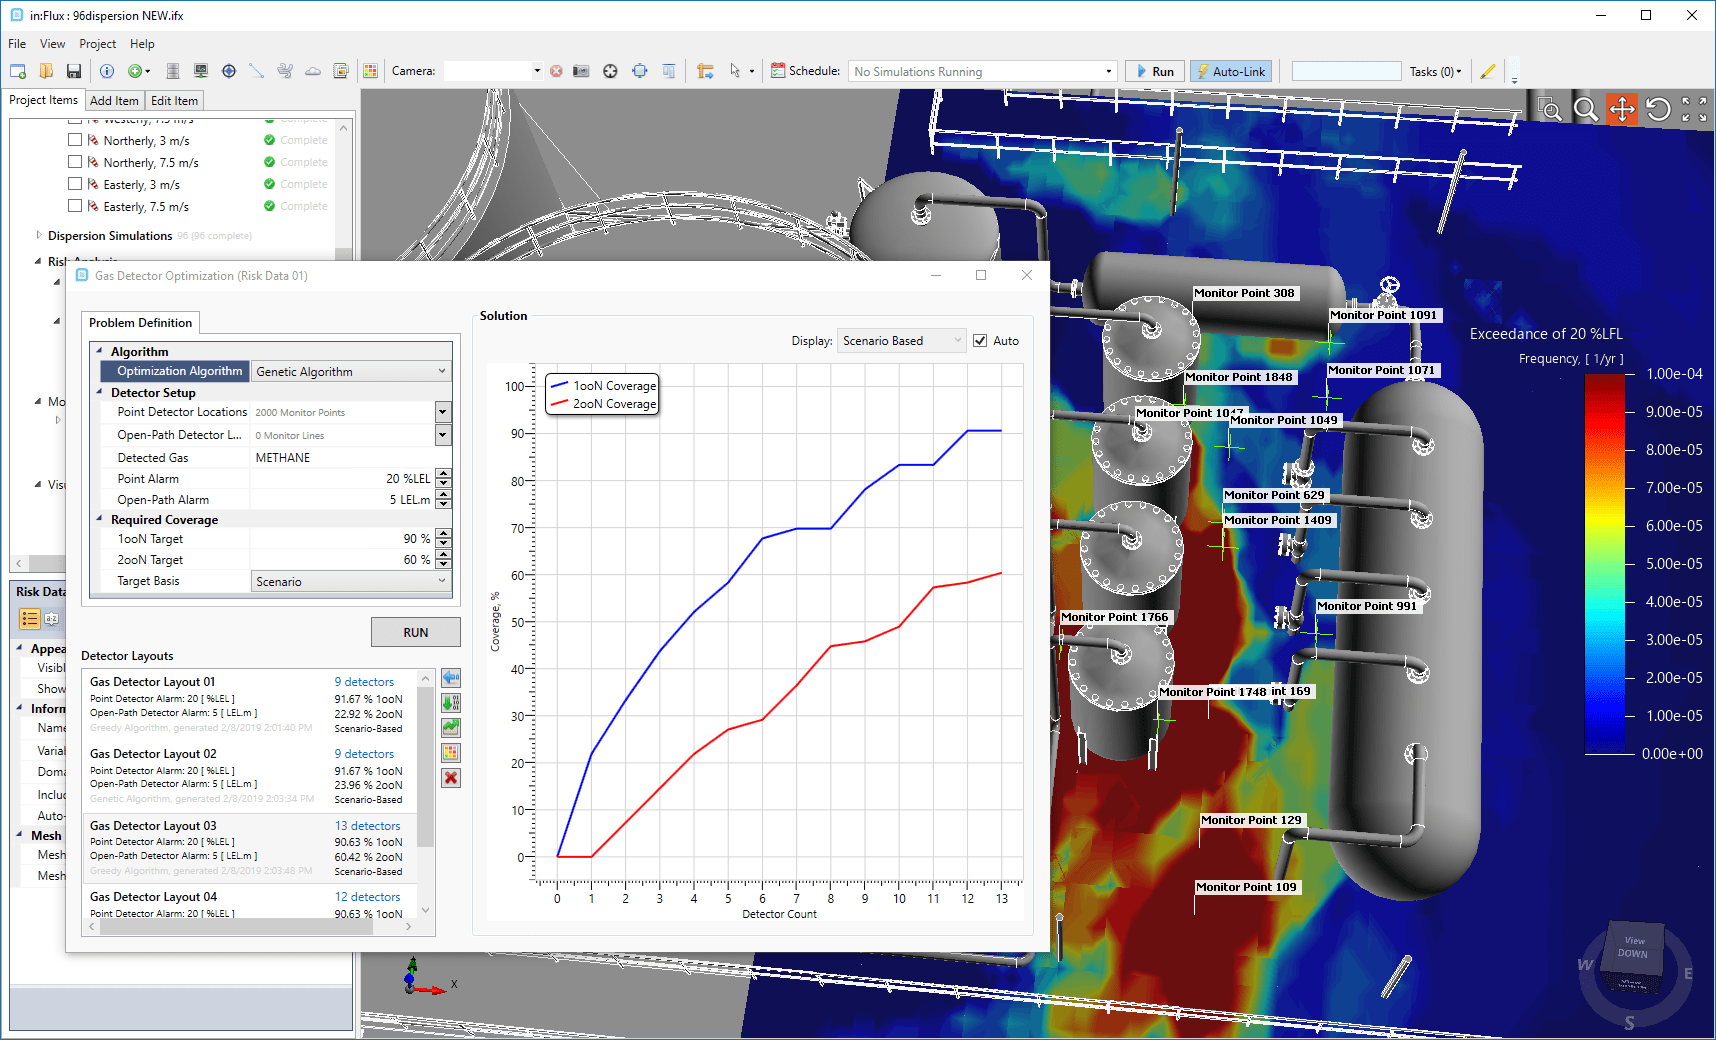
We are pleased to announce the release of in:Flux v1.20 in January 2019 which includes capabilities for risk analysis, including risk-based gas mapping. A new “Risk Manager” window enables the input of frequency data for gas leaks and a wind rose for environmental conditions to generate the full risk matrix. Thousands of simulations can be setup, run and processed with a single click from the risk manager.
in:Flux automatically sets-up, generates, and runs all the simulations in the risk matrix. With in:Flux it takes less than 7 days to complete 1000 CFD simulations. Once the simulations have completed, risk-based visualizations, such as exceedance of gas concentrations can be displayed with contours or isosurfaces.
Once the risk matrix has been calculated and potential gas detector locations defined, many different layouts can be quickly generated (in a few seconds), to compare variables such as performance target and alarm settings. The optimized gas detector layout can be exported to Excel or Detect3D (.d3d) project files. This analysis does not require any expertise in CFD, and typical setup times are less than 1 hour.
The release of this capability within in:Flux will popularize advanced CFD techniques for gas detector mapping, an area of analysis which has, to this point, only been available to companies who have been willing to invest significant time and resources in internal development. This has now changed – in:Flux users can perform this analysis at a fraction of the time and cost normally associated with CFD.
Contact Us or download our Gas Detector Optimization Information Packet from the in:Flux Downloads page.

Find us